
Market Timing tools should include the McClellan Oscillator. This oscillator created by Sherman and Marian McClellan in 1969, studies advancing issues versus declining issues using the exponential moving average (EMA) over a 39 and 19 day trading periods. For those interested in more history use this market timing link.
History aside, it is worth putting the McClellan Oscillator together with the Ultimate Oscillator and MACD for an overall market timing review. I have always found that combining the three almost always gives me a good indication on short-term market direction.
When all three market timing tools become incredibly bearish there is a very good chance of a change in market direction. The McClellan Oscillator readings are almost as low as on October 4. MACD is at a very bearish negative – 12.65 and widening and the Ultimate Oscillator is at a very low 28.89 which is deep in oversold territory.
Market Timing / Market Direction for Nov 25 2011 Show Deeply Oversold
All of these market timing readings are typical of a market low that normally can produce an excellent bounce. It is not a guarantee that the low is in, but certainly that a market direction change is about to happen.
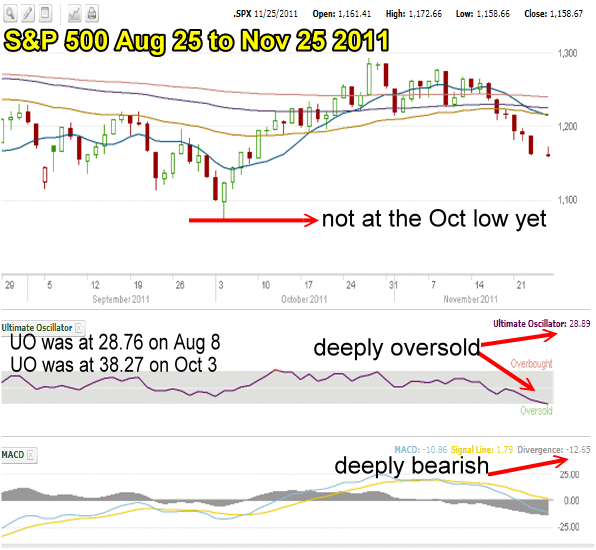
Market timing indicates that as of Friday's close the market could see a large bounce.
These same market timing readings were also found near the Oct 3 2011 market bounce and Aug 8 2011 market bounce. The technical indicators all point to a market deep in bearish territory, deeply oversold and ready to bounce.
Market Timing Reliability
The reliability of such market timing tools can be confirmed by looking at history. Just using the Ultimate Oscillator market timing tool there is a lot of evidence to support a bounce.
Ultimate Oscillator Market Timing History For 2008 Market Crash
Going back to the Oct 2008 market crash, on Oct 9 2008 the Ultimate Oscillator was at 23.38. The following day it moved to 28.84 and the market rallied. On October 27 2008 the Ultimate Oscillator was at 43.72 as it retested the Oct 9 low and then rallied again.
On Nov 20 2008 the market moved lower and the Ultimate Oscillator was at 36.69. Again the following day the market commenced a rally.
Ultimate Oscillator Market Timing History For 2009 Market Crash
On March 5 2009 the market was in full panic and the Ultimate Oscillator was at 25.11. It did not rally for two more days but the Ultimate Oscillator started rising on March 6 2009 signalling a deeply oversold market that was getting ready for a bounce.
On July 9 2009 the Ultimate Oscillator hit 38.16 and then continued the rally.
Ultimate Oscillator Market Timing History For 2010 and 2011
On July 1 2010 the Ultimate Oscillator stood at 31.07 and the following day the Ultimate Oscillator was higher. Within a day market direction changed and the rally was underway.
Earlier this year on June 13 2011 the Ultimate Oscillator stood at 31.07 and the market went sideways for two more days, the Ultimate Oscillator began to climb and the market rallied.
Market Timing / Market Direction – What They Are Saying Now
The Market Timing indicators cannot predict where the rally is going to go or even if it will start on Monday, but with such an extreme reading among all the market timing technical indicators I have mentioned, it is obvious to me that the market is on the verge of a market direction change to the upside.
Market Timing / Market Direction Summary for Nov 25 2011
On Friday the market direction turned up and for a brief period looked like the indices would close on the positive. However few investors want to hold their positions over the long weekend. However I believe a lot of the market direction move up was short sellers covering positions as Friday was a short day and any good news out of Europe or decent Black Friday retail sales could boost the market.
I believe the beginning of this week could see a better rally and any move higher will push more short sellers to cover positions, which should push the market even higher.
For any stocks I hold that do not have covered calls or which I was about to roll lower I will be waiting a day or so since I may get a better price for any covered calls. I sold more puts on Friday on JNJ Stock, MSFT Stock, INTC Stock and XOM Stock.
While there is no guarantee in anything related to risky assets like stocks, I will not be buying spy puts early in the week unless something dramatic happens in Europe to push markets to extremes. I have made very good profits for the year with my SPY PUT hedge and I do not see the need to risk capital at a time when market timing indicators are flashing deeply oversold.