
The battle over the debt ceiling continues with neither side seemingly willing to negotiate. A heard a good analogy today when an analyst said that as an investor it was kind of like Rome burning while the emperor played on his fiddle. The market direction outlook for today was for the market direction to stay under pressure. Economic news at present is being tossed by the wayside as investors remain focused on how long this impasse might last.
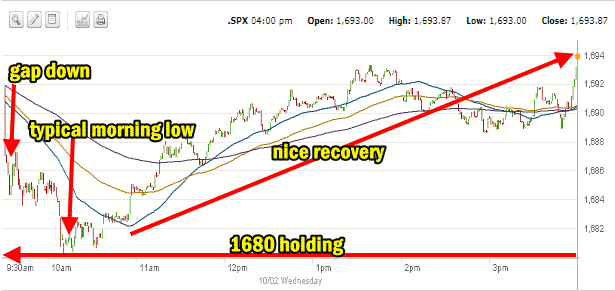
Market Direction Intraday Chart for Oct 2 2013
Another typical day on the S&P 500. Market direction started the day with a gap down and then a plunge into the typical morning low. The low came close to testing the 1680 level. After a couple of retests the market commenced a comeback rally. In the end the 1680 is continuing to hold the market direction up. How long this can last is tough to call but the NASDAQ, S&P 500 and IWM made a decent stab at recovering from early morning lows. The Dow also pushed back but still closed down
Advance Declines For Oct 2 2013
Declining issues narrowly beat out advancing stocks with 54% declining versus 42% advancing. New highs though were 121 with 91 new lows. The market direction while weak continues to show underlying buying going on and investors should be careful trading to the downside. Take profits often when available and watch for signs of a resolution to the debt ceiling which will probably result in a rally. It may be short-term but a rally nonetheless.
Market Direction Closing For Oct 2 2013
The S&P 500 closed at 1,693.87 down just 1.13. The Dow closed at 15,1133.14 down 58.56. The NASDAQ closed at 3,815.02 down 2.96 and continuing to trade near their most recent high. The Russell 2000 ETF, IWM was down 0.41% and continues to also show remarkable strength despite the pressure over the debt ceiling issue.
Market Direction Technical Indicators At The Close of Oct 2 2013
Let’s review the market direction technical indicators at the close of Oct 2 2013 on the S&P 500 and view the market direction outlook for Oct 3 2013.
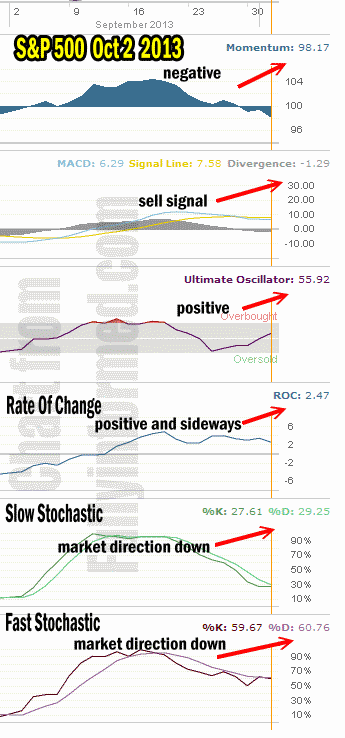
For Momentum I am using the 10 period. Momentum is still negative and is growing to the downside. It is still at reasonable levels though and it won’t take much to turn it back up, but the pressure to the downside is growing.
For MACD Histogram I am using the Fast Points set at 13, Slow Points at 26 and Smoothing at 9. MACD (Moving Averages Convergence / Divergence) issued a sell signal on the S&P 500 on Sep 30. The sell signal was confirmed for a second day today as the MACD reading continues to grow in strength to the downside.
The Ultimate Oscillator settings are Period 1 is 5, Period 2 is 10, Period 3 is 15, Factor 1 is 4, Factor 2 is 2 and Factor 3 is 1. These are not the default settings but are the settings I use with the S&P 500 chart set for 1 to 3 months.
The Ultimate Oscillator is back positive after turning negative just a few days ago.
Rate Of Change is set for a 21 period. The rate of change continues to be the only indicator that has remained positive throughout this latest period of weakness. It is trending sideways with a slight bias growing to the downside. It is signaling that there is still buying interest among investors. That can change quickly.
For the Slow Stochastic I use the K period of 14 and D period of 3. The Slow Stochastic is signaling that the market direction is down. As it looks out more than a day we could see more selling by into the end of th week.
For the Fast Stochastic I use the K period of 20 and D period of 5. These are not default settings but settings I set for the 1 to 3 month S&P 500 chart when it is set for daily. The Fast Stochastic is signaling that the market direction for tomorrow is almost neutral with a slight bias to the downside. Yesterday’s buy signal from the Fast Stochastic was not confirmed today.
Market Direction Outlook And Strategy for Oct 3 2013
The market direction is being held hostage here by the political wrangling. Luckily the 1680 level continues to hang on. How long that can last is anyone’s guess but the market direction technical indicators continue to grow in readings pointing to more weakness within stocks. If the rate of change starts to turn down sharply then watch for the market direction to shift lower. That is what could break through 1680.
Meanwhile this market direction gridlock is wonderful for trading market directional options like the SPY call and put options (I only do the put options) and IWM ETF for the trading for pennies strategy. I am continuing to receive emails from investors who are bringing in large profits during this stalemate period.
For Put Selling I am being careful just now and watching for only specific trades in strong stocks. I do believe the crisis will end and that could see stocks turn right around and push higher. But until then I am staying cautious with my Put Selling and remaining content to earn profits through the market directional trades.
For tomorrow the market direction technical indicators are fairly unchanged in the outlook which remains sideways with a growing bias to more downside. Today’s recovery was nice to see and impressive but the 1680 level can only be tested so often before investors will move lower with their bids.
Market Direction Internal Links
Profiting From Understanding Market Direction (Articles Index)
Understanding Short-Term Signals
Market Direction Portfolio Trades (Members)