
The market direction outlook for Monday was for stocks to trend sideways but continue to push higher. The consolidating that has gone on is continuing, but before we look at where we could be heading let look at what happened today with the S&P 500 to get a “feel” for what is happening intraday.
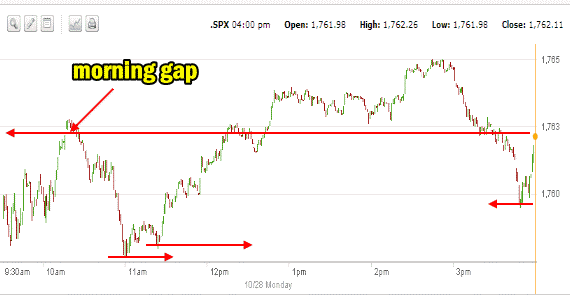
Market Direction S&P 500 Intraday For Oct 28 2013
The intraday 1 minute chart for the S&P 500 for Monday below shows the sideways action was not quite as dominant today as it was on Friday. Friday’s intraday pattern was more typical of a market direction consolidating gains. Today’s market direction is showing some concern among investors that the market direction is looking more like it may stall here. Whether that is true or not I’ll know when we look at the Market Direction Technical Analysis further down in tonight’s article. Meanwhile you can see that the market put in the typical morning low and then came close to revisiting that low at the end of the day.
I wrote during the day in my intraday comments that the market looked like it would close around 1762 which was the morning gap. When the market pushed up to 1765 shortly before 3:00, I stepped in and bought Spy Put Options for a quick trade lower. This was an obvious choice to me. I have seen this pattern of an intraday gap in the morning and then a close back at that gap many times. It was a sweet trade. The morning saw another trading for pennies trade and the afternoon a Spy Put Options trade. I could not ask for more.
 Advance Declines For Oct 28 2013
The advance – decline ratio favored decliners today with 53% of all stocks declining and 44% advancing. New highs though continue to far outstrip the lows. 739 new highs again today versus 118 new lows. The market remains strictly consolidating and there is an underlying strength within stocks that is not evaporating yet.
Market Direction Closing For Oct 28 2013
The S&P 500 closed at 1,762.11 up 2.34 and setting another new intraday all-time high. The Dow closed at 15,568.93 down 1.35. The NASDAQ closed at 3,940.13 down 3.23. The IWM ETF closed down just 5 cents at $111.03.
Market Direction Technical Indicators At The Close of Oct 28 2013
Let’s review the market direction technical indicators at the close of Oct 28 2013 on the S&P 500 and view the market direction outlook for Oct 29 2013.
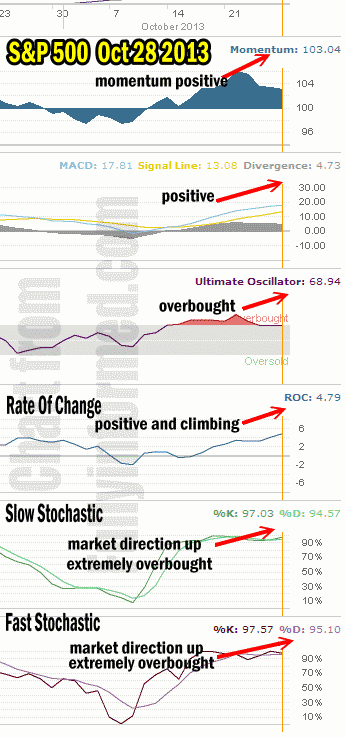
For Momentum I am using the 10 period. Momentum is still quite positive but it is remaining flat with a slight but growing bias to the downside. The bias down is very slight which at this stage means it is nothing to be concerned about but it should be watched.
For MACD Histogram I am using the Fast Points set at 13, Slow Points at 26 and Smoothing at 9. MACD (Moving Averages Convergence / Divergence) issued a buy signal on Oct 14. The signal continued strong today but did decline once again from Friday’s reading. This marks the fourth day of declining readings.
The Ultimate Oscillator settings are Period 1 is 5, Period 2 is 10, Period 3 is 15, Factor 1 is 4, Factor 2 is 2 and Factor 3 is 1. These are not the default settings but are the settings I use with the S&P 500 chart set for 1 to 3 months.
The Ultimate Oscillator is still shows overbought but you can see how the readings are now flattening out. The overbought condition is about ready to change.
Rate Of Change is set for a 21 period. The Rate Of Change is back moving higher which shows that investors were busy buying some stocks that dipped today.
For the Slow Stochastic I use the K period of 14 and D period of 3. The Slow Stochastic is signaling that the market direction is up and it is still extremely overbought.
For the Fast Stochastic I use the K period of 20 and D period of 5. These are not default settings but settings I set for the 1 to 3 month S&P 500 chart when it is set for daily. The Fast Stochastic is signaling that the market direction for Tuesday is up. It remains extremely overbought as well.
Market Direction Outlook And Strategy for Oct 29 2013
For Tuesday the market direction technical tools are still very positive and signaling that the market direction up is intact. While momentum and MACD are reflecting a bit of growing weakness, overall the strength lies to the upside for stocks.
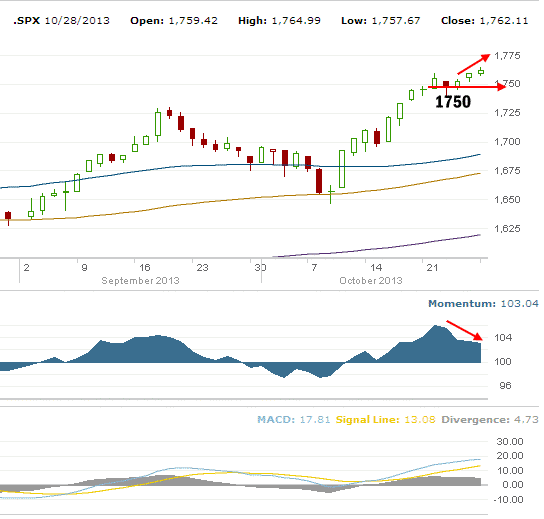
There is a bit of concern among a growing number of investors that the move higher is stalling out. This is the fifth day of the S&P 500 consolidating recent gains. This is not unusual but the nervousness of some investors is understandable. Momentum is showing a slight bias down and MACD is also weakening. Part of this could easily be the result of the S&P 500 slowing its advance. During the first 8 days of the advance the S&P 500 gained 83.78 points. Over the next 5 days which includes today the S&P 500 has gained just 17.45 points. The slowing of the rally is definitely being reflected in the momentum and MACD technical indicators.
Meanwhile the Rate Of Change is continuing to show that more investors are picking up stocks on dips. This strength is helping the market direction to consolidate recent gains. It also is part of the reason why the overbought nature of the market direction refuses to erode quickly. So on one hand stocks are slowing their advance daily but investors, convinced the trend is a lot higher, are continuing to pick up stocks on dips which on the other hand is keeping the market direction very overbought and making it difficult to regain more traction to the upside.
This see-saw effect is still heavily biased to the upside but the advance decline ratio needs to be watched to make sure that the trend up remains solid. The key to the market direction for the S&P is 1750. As long as it holds, there is no concern.
One of the biggest problems facing the market direction up right now is the number of bullish investors and analysts. It is rare when this many investors are correct. The majority is almost always wrong with stocks so while the trend remains up the majority of investors remain bullish which in the contrarian outlook tells investors stocks are too high.
For Tuesday then, the market direction technical indicators are pointing to another green day. The consolidating is probably coming to an end shortly. A lot of the market direction was on hold today pending the results from Apple Stock. With that now behind the markets, the direction may be about to resume to move up. I would expect another green closing tomorrow based on the market direction technical indicators.
Market Direction Internal Links
Profiting From Understanding Market Direction (Articles Index)
Understanding Short-Term Signals
Market Direction Portfolio Trades (Members)