
Monday’s outlook was for downside in market direction along with a wait and see approach for just how low the indexes would fall due to the Ukrainian crisis. With concern among investors staying to the forefront all day, it was interesting to see that the S&P held to close about the 1840 level and all the indexes closed well above their low points intraday. Let’s take a look at the S&P for the day and then see what the technical indicators are advising for Tuesday.
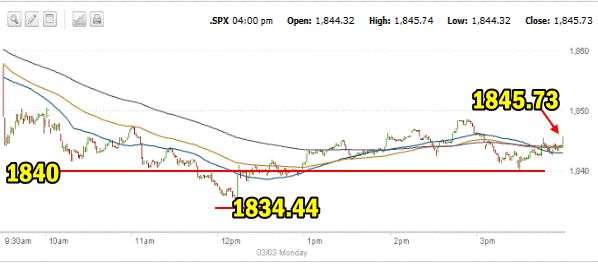
S&P Market Direction Intraday for March 3 2014
The one minute chart below shows the market direction action for March 3 2014. The drop at the open was anticipated due to the Ukrainian crisis. By noon hour the market has put in a pattern of lower highs and broke through the 1840 support level falling to 1834.44. That bottomed that S&P and investors stepped in picking through stocks and pushing the market back up. There was a bit of additional selling in the later afternoon into the close which saw the S&P come close to the 1840 level. However when the selling failed to break through the 1840 level around 3:30, the market direction moved back higher and the S&P closed at 1845.73. The test during the day of the 1840 level was interesting. The 1840 was easily broken through but within a few minutes of the market direction falling to 1834.44, the market bounced right back to 1840. This testing of 1840 is significant and if the crisis evaporates over the next several days, the market direction is sure to move higher and a lot of any such move higher will be due to the support of the 1840 level which we saw today.
Advance Declines For March 3 2014
One of the more interesting statistics from today’s market direction has to be the advance – decline numbers. Despite all the selling, declining issues made up only 63% and advancing issues were still at 33%. This is quite remarkable considering the decline in the indexes and most stocks. There were though only 100 new highs and 77 new lows.
Market Direction Closings For March 3 2014
The S&P closed at 1845.73 down 13.72. The Dow closed at 16,168.03 down 153.58. The NASDAQ closed at 4277.30 down 30.82.
The Russell 2000 ETF IWM was the strongest of the indexes. It closed at 116.89 down just 63 cents or half a percent on the day.
Market Direction Technical Indicators At The Close of March 3 2014
Let’s review the market direction technical indicators at the close of March 3 2014 on the S&P 500 and view the market direction outlook for March 4 2014.
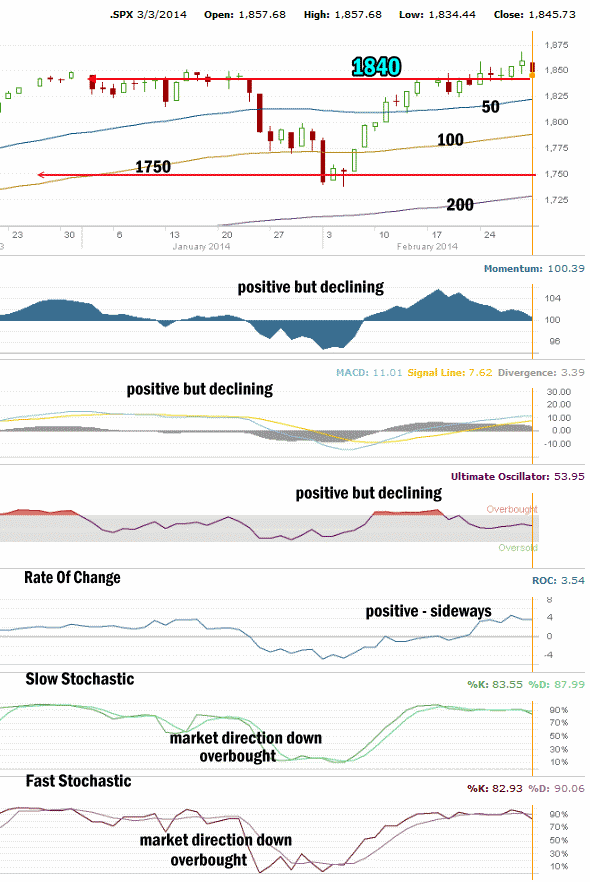
The 1750 level is holding the S&P up. Today the S&P closed above the 1840 level for the sixth day. Intraday the S&P fell back below 1840 but then quickly recovered. There is growing strength at the 1840 level and intraday the S&P made another new all-time high before the Ukrainian crisis pushed stocks lower. The 1840 level is busy building support as you can see in the chart above. The next move due to the Ukrainian crisis is probably lower but this building process will be used later once this crisis fades.
For Momentum I am using the 10 period. Momentum has been the best indicator over the past two months, replacing MACD as the most accurate indicator. Momentum over the past several days has been declining. Today’s drop in the markets has pushed momentum to the point where it is ready to turn negative.
For MACD Histogram I am using the Fast Points set at 13, Slow Points at 26 and Smoothing at 9. MACD (Moving Averages Convergence / Divergence) issued a buy signal on Feb 11. MACD moved lower again today but it is still not near a sell signal and has a lot more room to fall.,
The Ultimate Oscillator settings are Period 1 is 5, Period 2 is 10, Period 3 is 15, Factor 1 is 4, Factor 2 is 2 and Factor 3 is 1. These are not the default settings but are the settings I use with the S&P 500 chart set for 1 to 3 months.
The Ultimate Oscillator is positive but it too is declining.
Rate Of Change is set for a 21 period. The rate of change surprisingly had turned sideways by the close today signaling that investors were busy picking up stocks, obviously convinced that this sell-off is a trading opportunity.
For the Slow Stochastic I use the K period of 14 and D period of 3. The Slow Stochastic is signaling that the market direction is down for Tuesday. It is overbought but certainly has moved away from being extremely overbought.
For the Fast Stochastic I use the K period of 20 and D period of 5. These are not default settings but settings I set for the 1 to 3 month S&P 500 chart when it is set for daily. The Fast Stochastic is signaling that Tuesday will also be lower and it too is now just overbought having pulled lower from more extreme overbought readings.
Market Direction Outlook And Strategy for March 4 2014
Among my market direction comments yesterday was the statement that I am not expecting this downturn to be large. Today’s recovery from the lows shows the strength that remains with stocks. Many investors saw the sell-off as an opportunity for trading and picking up stocks at prices lower than Friday. The S&P pushing back above the 1840 level by the close was also very nice to see.
For tomorrow the technical indicators are all moving lower but the Rate Of Change indicator was actually trending sideways by the close. This shows the strength to the bull side for stocks. I did a lot of trades today and continue to carefully select stocks for Put Selling based on their overall strength. AT&T Stock is a good example where I sold the $31 put strike for March 22 options expiry for just over half a percent. This is the type of trade I am watching for in the present market environment.
For Tuesday I am expecting more weakness but I won’t be surprised if the indexes fail to move as low as they did today which will be a sign of strength for stocks. Unless the Ukrainian crisis should escalate further, I am expecting more weakness but actually more sideways action with a bias to the downside, than anything else.
Investors at present are “keen” on stocks and are looking at this crisis as an opportunity. I tend to agree with them and am continuing to trade the momentum to the downside through the Spy Put Options and the market direction portfolio as well as selling puts. For concerned investors who still want to sell puts, this is the type of environment where put credit spreads are better, but standing aside and waiting for things to clear is also a strategy that can work well. There is always another day to invest. Investing is about long-term capital growth and income. Stepping aside when the market direction is uncertain and your comfort level is low is also a strategy. Preservation of capital is always important.
ADDENDUM – 3:00 AM
With the news that Putin has ordered troops back to bases following military exercised, the Russian currency has risen, oil and gold have fallen and European and Asia stock markets have risen. This means that the market direction for Tuesday should see a strong bounce back and a move higher during the day. The weakness I had anticipated due to the Ukrainian Crisis should not be an issue on Tuesday.
Market Direction Internal Links
Profiting From Understanding Market Direction (Articles Index)
Understanding Short-Term Signals
Market Direction Portfolio Trades (Members)
Market Direction External Links
Market Direction IWM ETF Russell 2000 Fund Info
Market Direction SPY ETF 500 Fund Info