
The market direction on Tuesday followed what was predicted. Stock opened lower and tried to make a comeback and then fell lower once again during the day. The overbought condition of the market along with various somewhat confusing economic signals including poor small business sentiment, climbing inventories, a few rattling earnings reports including McDonalds added to a rather cloudy picture. But the big factor is the market direction is overbought on the S&P and NASDAQ and the Dow continues to drag the market as it has been unable to recover the December 31 high.
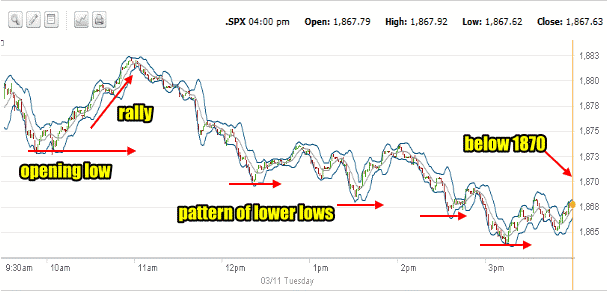
S&P Market Direction Intraday for March 11 2014
The one minute intraday S&P chart below shows today’s decline. There was an opening low within 20 minutes of the open and then a rally attempt which placed the S&P into positive territory but only briefly. From there by 11:00 AM the rally was over and the market direction pushed lower almost into the close. The market set up a pattern of lower lows throughout the remainder of the day and closed below 1870. The 1840 support level is what we need to keep an eye on now.
Advance Declines For March 11 2014
Advancing issues made up just 31% of stocks on Tuesday with declining issues hitting 65%. New highs though continued to stay above new lows with 121 new highs and 81 new lows.
Market Direction Closings For March 11 2014
The S&P closed at 1867.63 down 9.54. The Dow closed at 16,351.25 down 67.43. The NASDAQ closed at 4307.19 down 27.26.
The Russell 2000 ETF IWM closed down $1.24 at 118.06.
Market Direction Technical Indicators At The Close of March 11 2014
Let’s review the market direction technical indicators at the close of March 11 2014 on the S&P 500 and view the market direction outlook for March 12 2014.
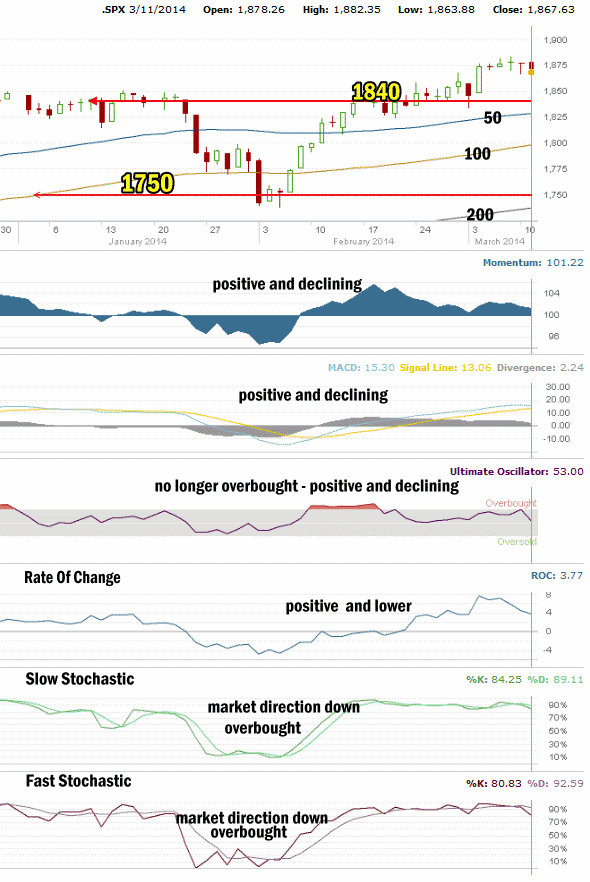
The 1750 level is holding the S&P up. The 1840 is now the first line of support against any a pullback. There is not significant support above 1840. It will be an easy move lower for the markets to slide to 1840 is investors become nervous..
For Momentum I am using the 10 period. Momentum has been the best indicator over the past two months, replacing MACD as the most accurate indicator. Momentum is continuing to decline but is still positive..
For MACD Histogram I am using the Fast Points set at 13, Slow Points at 26 and Smoothing at 9. MACD (Moving Averages Convergence / Divergence) issued a buy signal on Feb 11. MACD continued to decline on Tuesday but is still positive.
The Ultimate Oscillator settings are Period 1 is 5, Period 2 is 10, Period 3 is 15, Factor 1 is 4, Factor 2 is 2 and Factor 3 is 1. These are not the default settings but are the settings I use with the S&P 500 chart set for 1 to 3 months.
The Ultimate Oscillator is positive but tumbled out of overbought territory to close down at 53.00. This is quite the fall for the Ultimate Oscillator and signals growing weakness in the S&P.
Rate Of Change is set for a 21 period. The rate of change is still bullish but continuing to fall showing a lack of buying interest among investors for more than just day or swing trading.
For the Slow Stochastic I use the K period of 14 and D period of 3. The Slow Stochastic is signaling that the market direction is down again for Wednesday. It is overbought.
For the Fast Stochastic I use the K period of 20 and D period of 5. These are not default settings but settings I set for the 1 to 3 month S&P 500 chart when it is set for daily. The Fast Stochastic is signaling that the market direction is also down again for Wednesday and it too is overbought.
Market Direction Outlook And Strategy for March 12 2014
The market weakness predicted is being seen in all the indexes but there are still no clear indicators that we have entered a strong market top. If anything the signals continue to point to weakness but an underlying strength remains. Stocks are now moving out of being overbought so this next stage is important. With the overbought condition eroding rapidly now, stocks can regain some momentum to the upside. Whether they can do that this week is tough to call beyond a day or two.
At present the market direction technical indicators are pointing to more weakness ahead for tomorrow. The stochastic indicators were signalling sell on Monday which they confirmed on Tuesday. But there are still technical indicators that are positive, although they are also falling.
For Wednesday then the technical outlook is for more weakness. There could be an attempt at a rally at the open and then more selling for much of the day. I am expecting continued weakness for most of Wednesday but remember that markets can surprise to both the upside as well as the downside. If investors feel the present weakness is overdone they could push back although I do not see a lot of “bargains” among the stocks on my watch list at present. Instead I think stocks have room to pull back further.
Market Direction Internal Links
Profiting From Understanding Market Direction (Articles Index)
Understanding Short-Term Signals
Market Direction Portfolio Trades (Members)
Market Direction External Links
Market Direction IWM ETF Russell 2000 Fund Info
Market Direction SPY ETF 500 Fund Info