
The outlook for Wednesday was for stocks to head lower. At the outset stocks were moving lower and then the Fed minutes hit the market. Basically the minutes showed that central bank officials would consider raising rates only when measures of the economy’s health and inflation signaled the time was right. While this might not seem like anything new the minutes also showed that the Fed had moved away from linking any rate change to any specific period. To investors this meant no interest rate rises probably even into the Spring of next year especially if the global economy continued to be slow. This drop the US dollar and investors bought and sent stocks soaring to their best day this year.
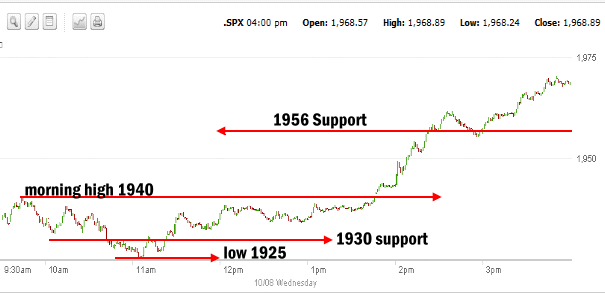
SPX Market Direction Intraday Chart
Today’s intraday chart shows the significant action the Fed minutes induced. The morning high was at 1940 and by 11:00 AM the SPX had fallen through support at 1930 and was heading down to 1925. This sparked a small rally which pushed stocks back up to around the 1938 level for the lunch hour. The Fed minutes when released shoved stocks higher and investors jumped in quickly to pick up stocks again. The 1956 support level saw a short period of wavering as investors tried to decide whether to hold 1956 or not. From there the market pushed still higher to close at the high of 1968.89.
Market Direction for Oct 8 2014
Advance Declines For Oct 8 2014
Volume picked up again today thanks to the rally with 4.3 billion shares traded, with 78% of that volume traded to the upside and just 19% to the downside. New lows though came in at 283 as the market was falling deeply in the morning. New highs were just 36, but that should change shortly. Despite the advance decline ratio supporting declining issues, the overwhelming up volume today was all about the Fed minutes.
Market Direction Closings For Oct 8 2014
The S&P closed at 1968.89 up 33.79. The Dow closed at 16,994.22 up 274.83. The NASDAQ closed at 4468.59 up 83.39.
Market Direction Technical Indicators At The Close of Oct 8 2014
Let’s review the market direction technical indicators at the close of Oct 8 2014 on the S&P 500 and view the market direction outlook for Oct 9 2014.
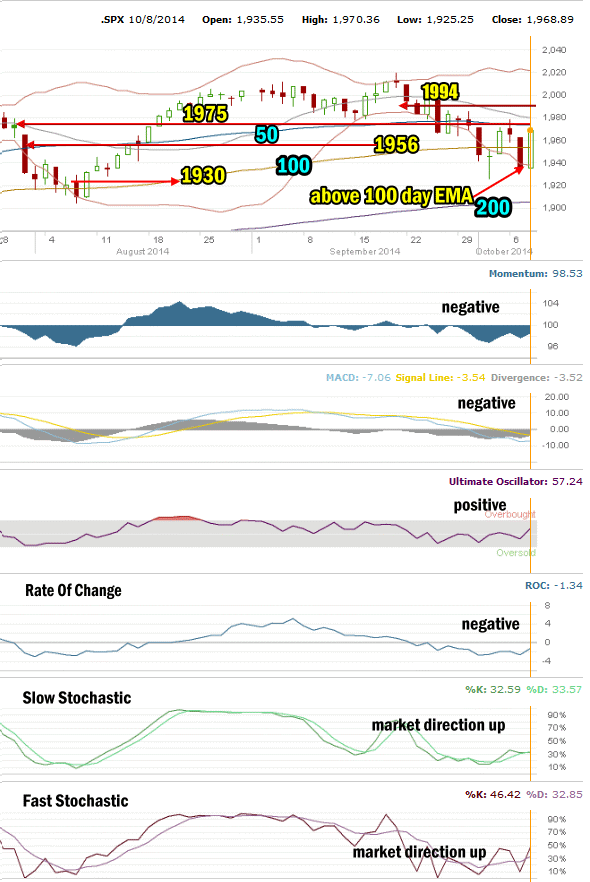
Market Direction Technical Analysis for Oct 08 2014
Stock Chart Comments: Today the SPX tested the 1930 level and while it did hold, it was the Fed minutes the rebuilt investor confidence that the economic world is not coming apart and interest rates are not going to rise any time soon. The SPX is now just below the 50 day and comfortably above the 100 day. It will retake 1975 tomorrow.
1994 Support: The 1994 level is now resistance.
1975, 1956 Support: 1975 should fall easily tomorrow and both will become support levels again.
1930 Support: Light support is found at 1930 but held the market in check today.
Strong Support Levels are at 1870 and 1840 (no longer shown). At present the strength of the upturn means the chance of these levels being tested is low.
The other two support levels not shown in the chart above are 1775 and 1750. I have explained that these two are critical support for the present bull market. While 1775 is important, it is 1750 that is the bottom line.
A break of 1750 would mark a severe correction of more than 13% from the most recent high. This would be the biggest correction since April 2012. A pull-back of that size would definitely stun investors at this point and it is not something I am anticipating as there are no signs of any impending correction of that magnitude.
Momentum: For Momentum I am using the 10 period. Momentum has been the best indicator, replacing MACD as the most accurate indicator. Momentum remained negative today but rose with the rally.
MACD Histogram: For MACD Histogram, I am using the Fast Points set at 13, Slow Points at 26 and Smoothing at 9. MACD (Moving Averages Convergence / Divergence) issued a confirmed sell signal on Sept 10. MACD is still negative but rose with the rally.
Ultimate Oscillator: The Ultimate Oscillator settings are: Period 1 is 5, Period 2 is 10, Period 3 is 15, Factor 1 is 4, Factor 2 is 2 and Factor 3 is 1. These are not the default settings but are the settings I use with the S&P 500 chart set for 1 to 3 months. The Ultimate Oscillator punched through to positive territory and is actually nearing overbought thanks to the strength of the rally today.
Rate of Change: Rate Of Change is set for a 21 period. The rate of change is negative but turning up.
Slow Stochastic: For the Slow Stochastic I use the K period of 14 and D period of 3. As the Slow Stochastic tries to predict the market direction further out than just one day. The Slow Stochastic is giving a weak up signal at the close today.
Fast Stochastic: For the Fast Stochastic I use the K period of 20 and D period of 5. These are not default settings but settings I set for the 1 to 3 month S&P 500 chart when it is set for daily. The Fast Stochastic is signaling strongly up at the close today.
Market Direction Outlook And Strategy for Oct 9 2014
Three technical indicators are pointing up for tomorrow and 3 are still negative but turning up. The Fed minutes have created a floor for stocks again and the next trend is back to up.
My trading to the downside ended today. While nothing ever moves straight up or down, the Fed is determined to support the economy and that means stocks as well. The saying “Don’t fight the Fed” definitely relates to the market at this point.
For Thursday stocks will retake 1975 and try to move higher into the weekend.
Stay FullyInformed With Email Updates
Market Direction Internal Links
Profiting From Understanding Market Direction (Articles Index)
Understanding Short-Term Signals
Market Direction Portfolio Trades (Members)
Market Direction External Links
IWM ETF Russell 2000 Fund Info
Market Direction SPY ETF 500 Fund Info