
Yesterday oil was a drag on the markets. Today oil jumped on reports showing a decline in fuel inventories and crude stockpiles and on the back of Fed policy meeting statements that a rate hike for December was still a possibility. This lead some traders to envision a return to some inflation which would drive oil prices higher. That bolstered stocks which also moved higher. It was quite the day for stocks.
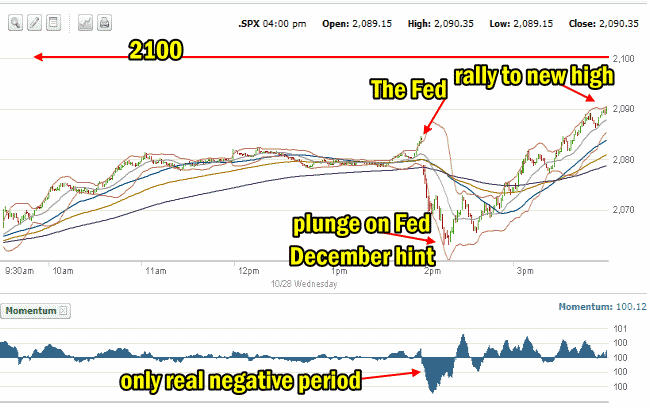
SPX Intraday Chart
The intraday chart set for 1 minute shows the whole tale of today’s action. The morning saw investors jump in and buy stocks. By 11:00 stocks had retaken the 2075 level and were back to 2080. That held for the lunch hour and into the Fed statements at 2:00 PM. In the final lead up to the Fed statements the market rallied for about 20 minutes and then with the hint of a December rate hike from the Fed, the market plunged. Analysts were split though. Half thought the Fed comments meant there was a good chance for a rate hike in December. Others felt there would be none no matter what the Fed indicated.
Oil had already started a rally earlier in the day when inventories showed a decline in both fuel and oil stockpiles in the US. Then Fed comments regarding a rate hike seemed to get investors thinking about inflation and they pushed oil to the best rally in 8 weeks. The rally continued into the afternoon and investors decided shortly after dumping stocks that the chance of a Fed rate hike in December, despite Fed comments, was probably next to nil. They bought back into stocks and the index quickly regrouped.
The gains was fast and furious as investors turned right around and began snapping up many of the stocks that less than 20 minutes earlier were being dumped. Volume in the last hour was over a billion shares as buying, both retail and computer, pushed the index to a new intraday high on the day which once again ended the day at the highest level since the correction in August had started.
Momentum was only negative for a short period during the day. Into the close it was strongly positive.
SPX Intraday Oct 28 2015
It ended up being quite the day. I had expected the S&P to close around the 2073 to 2075 level but the close was at 2090.
Market Direction Closings For Oct 28 2015
At the end of the day the indexes closed at their highs. The S&P closed at 2,090.35 up 24.46. The DOW closed at 17,779.52 up 198.09. The NASDAQ closed at 5,095.69 up 65.54.
Advance Decline Numbers
Volume on Wednesday was the highest in days at 4.68 billion shares. By the close over 80% of the volume was to the upside. New lows fell back from earlier numbers and closed at just 55 while new highs rose to 90.
The NASDAQ had 144 new highs and 85 new lows.
Once the numbers get back over 150 new highs the market direction up should have more staying power for all the indexes. Wednesday though was definitely a day for the bulls.
Market Direction Technical Indicators At The Close of Oct 28 2015
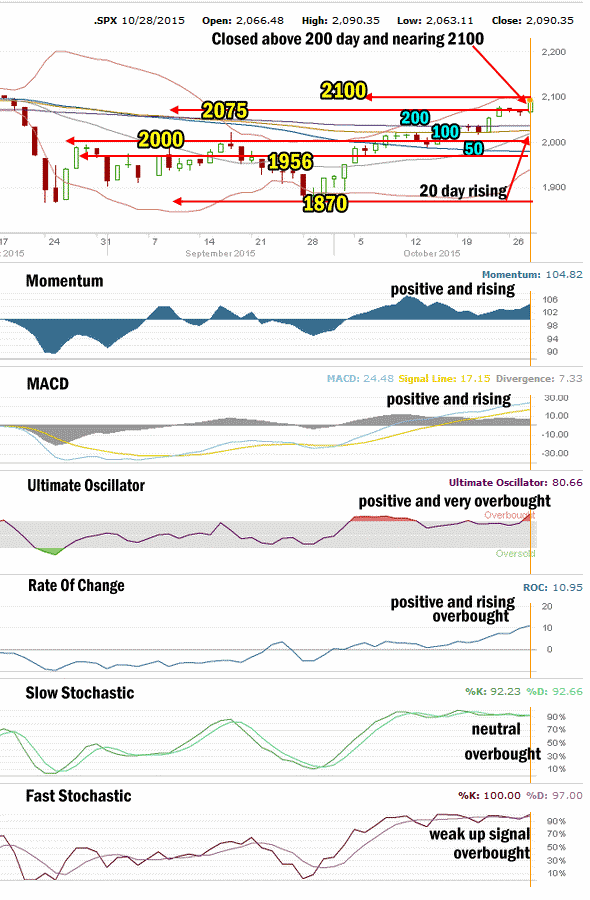
Market Direction Technical Analysis for Oct 28 2015
Stock Chart Comments:
The S&P closed above the 200 day moving average for the fifth time today and is within 10 points of the 2100 level which is back to some major support for the market. Remember the 2100 level was tough for the market to hold prior to the August correction. The 20 day simple moving average (SMA) is still pushing higher and getting ready to cross up and over the 100 day moving average. This will be a strong buy signal when it happens. This should happen on Thursday or Friday.
Support and Resistance Levels:
These are the present support and resistance levels.
2100 was light support. Stocks have been unable to stay above this level and push higher on numerous occasions. It remains resistance.
2075 is light support. Below that is 2050 which is light support. Stronger support is at 2000 which had repeatedly held the market up throughout each pullback in January and February but failed under the waves of selling in the last correction. Stocks continue to have trouble holding the 2000 level.
Weak support is at 1970 while stronger support is at 1956 and technically it is more important than 1970 for the market. 1940 is light support. 1920 is now light support. 1900 is more symbolic than anything else.
1870 and 1840 are both levels with strong enough support to delay the market falling and should see a sideways action attempt while investors decide whether to sell or buy. So far 1870 has held the market up better than any of the other support levels aside from 2000 which held the market up for months before the collapse in August.
The other two support levels are 1775 and 1750. I have explained that these two are critical support for the present bull market. While 1775 is important it is 1750 that is the bottom line.
A break of 1750 would mark a severe correction of 384.72 points or 18% from the all-time high of 2134.72. This would be the biggest correction since April 2012. A pull-back of that size would definitely stun investors and bring to question whether the bull market is finished.
Momentum: For momentum I use a 10 period when studying market direction. Momentum is positive and rising.
MACD Histogram: For MACD Histogram, I am using the Fast Points set at 13, Slow Points at 26 and Smoothing at 9. MACD (Moving Averages Convergence / Divergence) issued a buy signal on Friday Oct 2. That signal has lost strength since it was issued at the start of October, but today the signal started to pick up some strength again, which indicates more upside could be ahead for stocks.
Ultimate Oscillator: The Ultimate Oscillator settings are: Period 1 is 5, Period 2 is 10, Period 3 is 15, Factor 1 is 4, Factor 2 is 2 and Factor 3 is 1. These are not the default settings but are the settings I use with the S&P 500 chart set for 1 to 3 months. The Ultimate Oscillator is positive and moving higher. It is very overbought.
Rate of Change: Rate Of Change is set for a 21 period. The rate of change signal is positive but is now at a reading of 10.95 which almost always signals a reverse day coming up. This is too high a signal for the market to keep advancing. There is almost always a pullback of some kind when the signal is this high.
Slow Stochastic: For the Slow Stochastic I use the K period of 14 and D period of 3. The Slow Stochastic tries to predict the market direction further out than just one day. The Slow Stochastic is neutral with a slight down bias and very overbought.
Fast Stochastic: For the Fast Stochastic I use the K period of 20 and D period of 5. These are not default settings but settings I set for the 1 to 3 month S&P 500 chart when it is set for daily. The Fast Stochastic is pointing up for stocks and is very overbought.
Market Direction Outlook for Oct 29 2015
The market is very overbought. The technical indicators though are pointing to the market trying to move still higher. We should see the S&P break above the 2100 level either Thursday or Friday.
The overbought signals are telling. The Rate Of Change in particular is extremely high and today’s reading of 10.95 is almost always followed by the market pulling back. The extreme overbought signals are advising that stocks need a rest.
Volume today points to a bounce on Thursday morning and then some selling caused by the market being deeply overbought. From there I am expecting stocks to pullback in the afternoon but still end the day higher than today’s close.
Stay FullyInformed With Email Updates
Market Direction Internal Links
Profiting From Understanding Market Direction (Articles Index)
Understanding Short-Term Signals
Market Direction Portfolio Trades (Members)
Market Direction External Links
IWM ETF Russell 2000 Fund Info
Market Direction SPY ETF 500 Fund Info