
The outlook for Thursday was for stocks to push through to retake the 1975 level. Instead they pushed lower and closed at the lows of the day below the 1930 important support level. The collapse today of 40.68 points on the SPX ranks up there with April 10th drop of 42.17 points and Feb 3rd drop. It was among the bigger drops this year and as Dennis Gartman exclaimed, it was a “very very bad trading session” on CNBC. Gartman was surprised by the turn around from Thursday’s reversal up swing to today’s collapse. He explained he was buying in the morning and selling out in the afternoon. This whipsaw market certainly caught me by surprise today. I opened the day jumping into the upside of the market only to be stopped out and then switched to the downside shortly after 11:00 AM. There is never any use in fighting the trend and today that trend was all downhill.
SPX Market Direction Intraday Chart
Today’s intraday chart shows the movement from the opening through to 1:00 PM when the market landed at 1930. Steady selling all morning with down volume at 90% of all the volume traded. After 1:00 PM the market drifted sideways closing just below the important 1930 level at 1928.21.
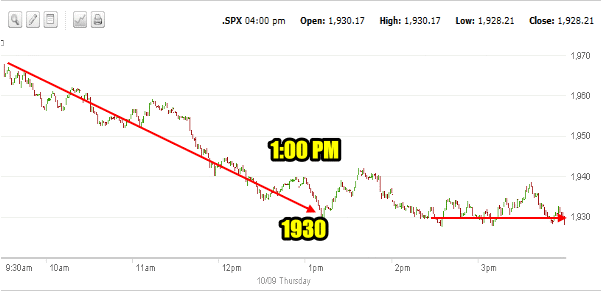
SPX intraday plunge of Oct 9 2014
Advance Declines For Oct 9 2014
Volume was almost identical to Wednesday with 4.3 billion shares traded and 86% of all stocks declining. There were 245 new lows but 40 new highs. This was a full reversal of Wednesday’s up move.
Market Direction Closings For Oct 9 2014
The S&P closed at 1928.21 down 40.68. The Dow closed at 16,659.25 down 334.97. The NASDAQ closed at 4378.34 down 90.26.
Market Direction Technical Indicators At The Close of Oct 9 2014
Let’s review the market direction technical indicators at the close of Oct 9 2014 on the S&P 500 and view the market direction outlook for Oct 10 2014.
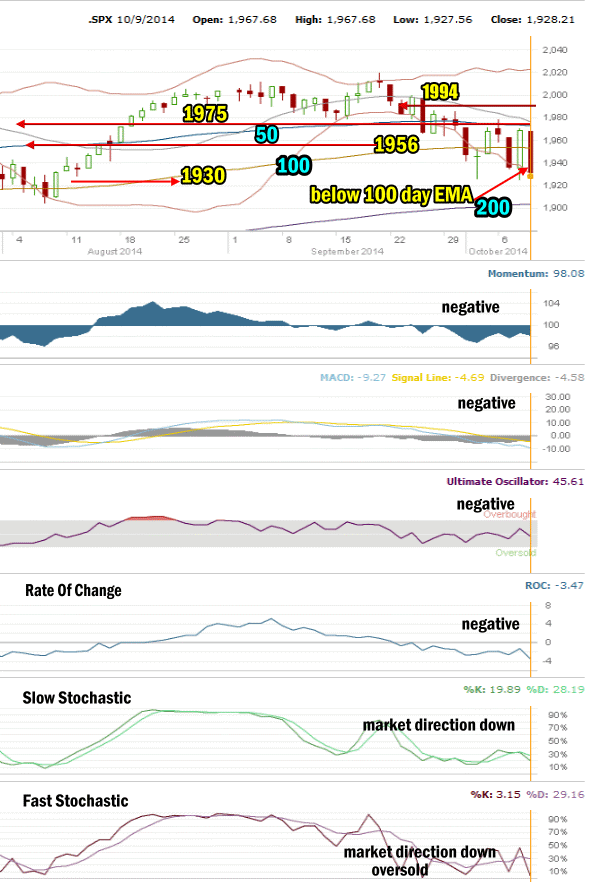
Market Direction Technical Analysis for Oct 9 2014
Stock Chart Comments: Today the SPX fell back with investors nervous about everything from Ebola to a perceived slowing global growth and EU worries. The 1930 level was tested for much of the afternoon and the market closed just below it.
1994 Support: The 1994 level is now resistance.
1975, 1956 Support: Both are resistance levels again.
1930 Support: Light support is found at 1930 but held the market for most of the afternoon.
Strong Support Levels are at 1870 and 1840 (no longer shown). The viewpoint has changed again with 1870 a very likely target by next week.
The other two support levels not shown in the chart above are 1775 and 1750. I have explained that these two are critical support for the present bull market. While 1775 is important, it is 1750 that is the bottom line.
A break of 1750 would mark a severe correction of more than 13% from the most recent high. This would be the biggest correction since April 2012. A pull-back of that size would definitely stun investors at this point and it is not something I am anticipating as there are no signs of any impending correction of that magnitude.
Momentum: For Momentum I am using the 10 period. Momentum has been the best indicator, replacing MACD as the most accurate indicator. Momentum remained negative today and fell lower.
MACD Histogram: For MACD Histogram, I am using the Fast Points set at 13, Slow Points at 26 and Smoothing at 9. MACD (Moving Averages Convergence / Divergence) issued a confirmed sell signal on Sept 10. MACD is still negative and fell lower today.
Ultimate Oscillator: The Ultimate Oscillator settings are: Period 1 is 5, Period 2 is 10, Period 3 is 15, Factor 1 is 4, Factor 2 is 2 and Factor 3 is 1. These are not the default settings but are the settings I use with the S&P 500 chart set for 1 to 3 months. The Ultimate Oscillator fell back negative today.
Rate of Change: Rate Of Change is set for a 21 period. The rate of change is negative and falling.
Slow Stochastic: For the Slow Stochastic I use the K period of 14 and D period of 3. As the Slow Stochastic tries to predict the market direction further out than just one day. The Slow Stochastic is signaling down for Friday.
Fast Stochastic: For the Fast Stochastic I use the K period of 20 and D period of 5. These are not default settings but settings I set for the 1 to 3 month S&P 500 chart when it is set for daily. The Fast Stochastic is signaling down for Friday and is extremely oversold.
Market Direction Outlook And Strategy for Oct 10 2014
My outlook was dead wrong for Thursday. The Fed minutes resulted in a strong rally which should have turned the market higher today and did not. The push lower and full give back of the rally from Wednesday is not new for the markets but it is very bearish.
Three technical indicators are pointing down for tomorrow and the 1930 support level, not strong to begin with, appears ready to break. The next stop then would be 1900 which is pretty well the 200 day exponential moving average (EMA). This would result in a full correction and a probable break down to the next support level which is 1870.
Yesterday I ended trading to the downside and turned back to the upside. It was a mistake. By shortly after 11:00 my upside positions were wiped out and I was back trading to the downside. I have positions I have held into Friday.
For Friday the market direction looks weak and ready to fall lower. Today’s selling was so intense that the chance of an upswing after giving back Wednesday’s big rally is probably less than 5%. When this pullback commenced I indicated I thought the market would fall to 1930, test it and then end up at 1900 which is the 200 day exponential moving average (EMA). I still think that is likely. Whether stocks hit 1900 tomorrow is a tough call but momentum to the downside is strong and investors are nervous enough to keep selling on Friday. Whatever happens, the trend is back to lower.
Stay FullyInformed With Email Updates
Market Direction Internal Links
Profiting From Understanding Market Direction (Articles Index)
Understanding Short-Term Signals
Market Direction Portfolio Trades (Members)
Market Direction External Links
IWM ETF Russell 2000 Fund Info
Market Direction SPY ETF 500 Fund Info