
The outlook for Monday Nov 24 2014 was for stocks to move higher. This happened although much of the day was more a see-saw than up. Still the close tells all as the close was a new record close for the S&P and Dow. However neither index managed to close above the intraday highs they had set on Friday.
SPX Intraday Market Direction for Nov 24 2014
Looking at the one minute chart from Monday Nov 24 2014 the rally at the open actually set the high for the day. From there sellers stepped in and pushed stocks back slightly. The selling took the S&P down to 2066.50 which seemed to be enough for buyers to step in. They pushed stocks back up almost reaching the 2070 level before more selling brought stocks back to 2066.50. Stocks then entered a see-saw day and traded in a very tight range through the rest of the morning, the lunch hour and the afternoon until 3:20 PM when another rally was sparked which by the close was sitting at 2069.41 within reach of breaking through 2070. This places the S&P within 30 points of 2100 which at the start of the year seemed a tough goal to meet. Now the SPX seems ready to close the year even higher than 2100.
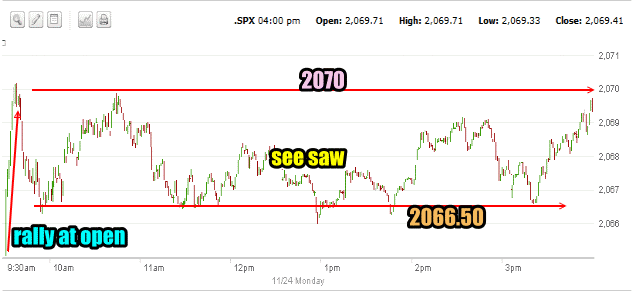
SPX intraday for Nov 24 2014
Advance Declines For Nov 24 2014
The see-saw day was obvious on Monday with just 3.1 billion shares traded and stocks almost evenly split between up and down volume. 53% of all volume was up and 46% down. New highs came in at 137 a drop from Friday and new lows were anemic at just 18. Despite the see-saw day the bulls were in charge on Monday.
Market Direction Closings For Nov 24 2014
The S&P closed at 2069.41 up 5.91. The Dow closed at 17,817.90 up 7.84. The NASDAQ closed at 4754.89 up 41.92.
Market Direction Technical Indicators At The Close of Nov 24 2014
Let’s review the market direction technical indicators at the close of Nov 24 2014 on the S&P 500 and view the market direction outlook for Nov 25 2014.
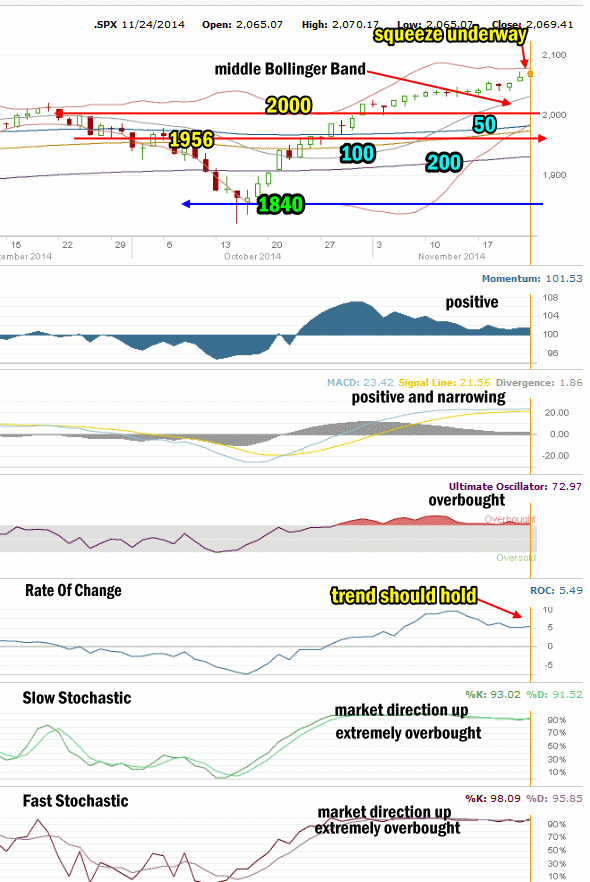
Market Direction Technical Analysis for Nov 24 2014
Stock Chart Comments: The trend higher continues with the candlesticks continuing to press toward the Upper Bollinger Band signaling the trend higher remains intact. The Bollinger Bands Squeeze is still underway and the Lower Bollinger Band has now broken through all the major moving averages (50, 100 and 200) and the 20 day is rising rapidly. .
Strong Support Levels are at 1870 and 1840. Both levels are strong enough to delay the market falling. 1956 and 1970 are back as support for stocks.
2000 is the highest level of support at present and while not strong, it should have enough strength to hold sellers back for at least a day in the event of an interim pullback. I am not expecting this to happen at this stage of the rally. The market direction no longer looks like it is consolidating. A move either up or down is rapidly coming.
The other two support levels not shown in the chart above are 1775 and 1750. I have explained that these two are critical support for the present bull market. While 1775 is important it is 1750 that is now the bottom line.
A break of 1750 would mark a severe correction of more than 13% from the most recent high. This would be the biggest correction since April 2012. A pull-back of that size would definitely stun investors at this point and it is not something I am anticipating at this time.
Momentum: For Momentum I am using the 10 period. Momentum is still positive and moving sideways.
MACD Histogram: For MACD Histogram, I am using the Fast Points set at 13, Slow Points at 26 and Smoothing at 9. MACD (Moving Averages Convergence / Divergence) issued a buy signal on October 22. MACD is no longer gaining strength and continues to narrow the divergence. It is however positive and that alone supports the outlook for stocks to continue to grind higher.
Ultimate Oscillator: The Ultimate Oscillator settings are: Period 1 is 5, Period 2 is 10, Period 3 is 15, Factor 1 is 4, Factor 2 is 2 and Factor 3 is 1. These are not the default settings but are the settings I use with the S&P 500 chart set for 1 to 3 months. The Ultimate Oscillator is positive and remains extremely overbought.
Rate of Change: Rate Of Change is set for a 21 period. The rate of change is staying positive and is now at 9.44 up from yesterday. The Rate Of Change has turned sideways which supports the outlook of no significant change in trend.
Slow Stochastic: For the Slow Stochastic I use the K period of 14 and D period of 3. As the Slow Stochastic tries to predict the market direction further out than just one day. The Slow Stochastic is signaling market direction is up and it is extremely overbought.
Fast Stochastic: For the Fast Stochastic I use the K period of 20 and D period of 5. These are not default settings but settings I set for the 1 to 3 month S&P 500 chart when it is set for daily. The Fast Stochastic is signaling up as well for stocks and is also extremely overbought.
Market Direction Outlook for Nov 25 2014
The two stochastic indicators are technically unreliable now as they are extremely overbought and continue to signal up, down and neutral depending on the share volumes traded daily. Once they begin to trend away from being heavily overbought the signals will be more reliable.
The general outlook for Tuesday is for stocks to continue to advance even though it may be modestly.
Stay FullyInformed With Email Updates
Market Direction Internal Links
Profiting From Understanding Market Direction (Articles Index)
Understanding Short-Term Signals
Market Direction Portfolio Trades (Members)