
Monday saw lower volume ahead of the long Thanksgiving weekend. Oil fell toward $40, then rallied on news of Saudi Arabia announcing yet again that they would work with OPEC to stabilize prices, and then closed down 15 cents at $41.75. Nothing really new was contained in the Saudi’s comments that they have not uttered before. With so many short positions on oil in the belief that it is heading to $35 perhaps in December, any news to the contrary always sees a jump as some traders cover their short positions, worried they will be left with losses on any kind of rally higher.
Gold hit the lowest level since 2010 and still looks bearish.
The other news to hit the market was the possibility that Allergan and PFIZER may not follow through on their $160 billion merger deal. That sent both stocks lower with PFIZER down 2.64% to $31.33 and Allergan down 3.44% to $301.72. Their decline impacted other stocks in the health care sector that moved lower in sympathy to the possibility that the merger might fail to happen.
Advance Decline Numbers
Volume lower by about 400 million shares to 3.55 billion shares on Monday. Of that volume 52% was trading lower and 46% was moving higher. There were 111 new lows which is a decrease from Friday’s 122 but new highs also slipped slightly to 70.
The NASDAQ saw up volume lower just slightly to 1.65 billion shares traded. 50% of all volume was traded to the upside which was better than the S&P. New lows were virtually unchanged at 76 and new highs were at 71.
The advance decline numbers show the market is certainly not falling apart by an stretch but weakness remains an issue..
Market Direction Closings
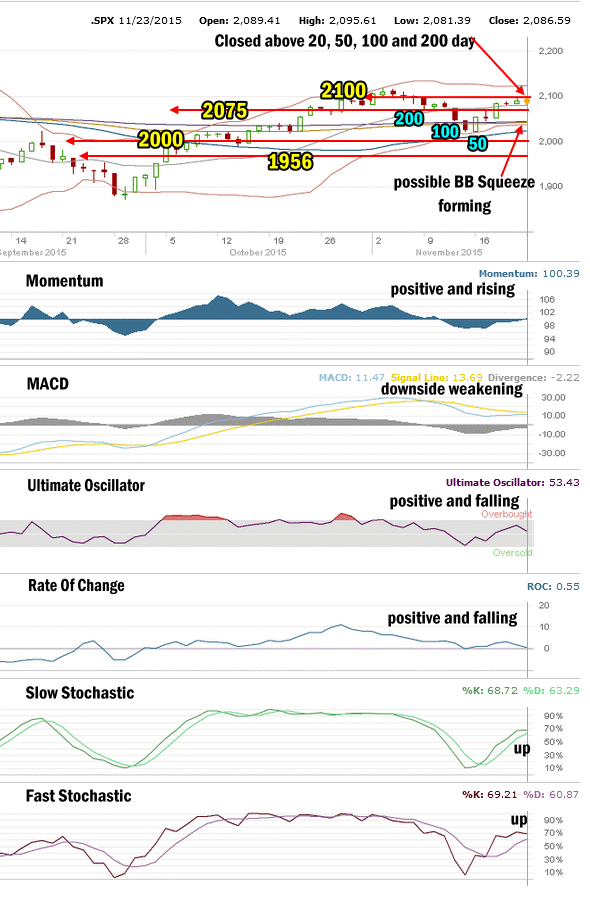
Losses were very small on Monday. The S&P closed at 2,086.59 down 2.58. The DOW closed at 17,792.68 down 31.13. The NASDAQ closed at 5,102.48 down 2.44.
Market Direction Technical Indicators At The Close of Nov 23 2015
SPX Market Direction Technical Analysis for Nov 23 2015
Stock Chart Comments:
The S&P closed on Monday with very slight losses and still above all major moving averages. This is though the third day with not much in the way of strength higher..
The 100 day moving average is still ready to move above the 200 day but there is not enough strength to push it above the 200 day. Meanwhile the 50 day moving average despite turning up, has a long way to go before regaining the lead in market direction.
Meanwhile The Lower Bollinger Band is still moving above the 50 day moving average which is a bearish signal and at the same time the Bollinger Bands look like they may be starting to form a Bollinger Bands Squeeze.
The closing candlestick is again bearish for stocks on Tuesday.
Support and Resistance Levels:
These are the present support and resistance levels.
2100 was light support. Stocks have been unable to stay above this level and push higher on numerous occasions. It remains resistance.
2075 is light support. Below that is 2050 which is light support. Stronger support is at 2000 which had repeatedly held the market up throughout each pullback in January and February but failed under the waves of selling in the last correction. Stocks continue to have trouble holding the 2000 level.
Weak support is at 1970 while stronger support is at 1956 and technically it is more important than 1970 for the market. 1940 is light support. 1920 is now light support. 1900 is more symbolic than anything else.
1870 and 1840 are both levels with strong enough support to delay the market falling and should see a sideways action attempt while investors decide whether to sell or buy. So far 1870 has held the market up better than any of the other support levels aside from 2000 which held the market up for months before the collapse in August.
The other two support levels are 1775 and 1750. I have explained that these two are critical support for the present bull market. While 1775 is important it is 1750 that is the bottom line.
A break of 1750 would mark a severe correction of 384.72 points or 18% from the all-time high of 2134.72. This would be the biggest correction since April 2012. A pull-back of that size would definitely stun investors and bring to question whether the bull market is finished.
Momentum: For momentum I use a 10 period when studying market direction. Momentum is back positive and trying to rise.
MACD Histogram: For MACD Histogram, I am using the Fast Points set at 13, Slow Points at 26 and Smoothing at 9. MACD (Moving Averages Convergence / Divergence) issued a sell signal on Friday Nov 10. That sell signal is weakening further on Monday.
Ultimate Oscillator: The Ultimate Oscillator settings are: Period 1 is 5, Period 2 is 10, Period 3 is 15, Factor 1 is 4, Factor 2 is 2 and Factor 3 is 1. These are not the default settings but are the settings I use with the S&P 500 chart set for 1 to 3 months. The Ultimate Oscillator is back positive but falling quickly on Monday.
Rate of Change: Rate Of Change is set for a 21 period. The rate of change signal is positive but falling to the point of almost turning negative.
Slow Stochastic: For the Slow Stochastic I use the K period of 14 and D period of 3. The Slow Stochastic tries to predict the market direction further out than just one day. The Slow Stochastic is signaling up for stocks but %K signal line is turning sideways which is concerning..
Fast Stochastic: For the Fast Stochastic I use the K period of 20 and D period of 5. These are not default settings but settings I set for the 1 to 3 month S&P 500 chart when it is set for daily. The Fast Stochastic is also signaling higher for stocks and the %K signal line has turned sideways and is starting to drop. We could see a sell signal tomorrow if the market moves lower.
Market Direction Outlook for Nov 24 2015
For Tuesday the technical indicators are now 5 positive and 1 negative. Of the 5 positive indicators only 1 is gaining strength. The remaining 4 positive indicators are losing strength quickly but the 1 negative indicators is also losing strength, so we have a very mixed outlook.
The closing candlestick on Friday had pointing to weakness for Monday. Today’s closing candlestick also pointed to weakness for Tuesday. Between all the indicators, a move higher is a possibility but it will be weak and on lower volumes as stocks head into the Thanksgiving week.
Normally this is a good week for stocks. I will go out on a limb here and predict a move higher on Tuesday based on history of this week, but technically, the indicators are showing weakness for Tuesday. Nothing is indicating any kind of large pullback so any weakness on Tuesday should be small, once again. For Tuesday then, I will call it mixed signals.
Stay FullyInformed With Email Updates
Market Direction Internal Links
Profiting From Understanding Market Direction (Articles Index)
Understanding Short-Term Signals
Market Direction Portfolio Trades (Members)
Market Direction External Links
IWM ETF Russell 2000 Fund Info
Market Direction SPY ETF 500 Fund Info