
The market direction outlook for Thursday was for stocks to continue to move higher. There were though some catalysts for investors to be aware of. These were the GDP and the Weekly Initial Unemployment Insurance Claims. Either or both could affect the markets. In the end it seemed that investors were willing to ignore to a degree, both of these as GDP showed a contraction of 1% marking the first contraction since 2011 and yet the Weekly Initial Unemployment Insurance Claims came in at just 300,000 which is bullish for stocks. Both of these are in stark contrast and yet both were somewhat ignored.
GDP Shrinks 1%
The GDP shrinking of 1% for the past quarter didn’t seem to concern many investors. While it is the first contraction since 2011, many investors believed economists who pointed out that the US faced one of the severest winters in decades. This, they claimed, accounted for the contraction. They they pointed to a raft of statistics that in their opinion show the US economy is improving and the next GDP will be a lot better.
Weekly Initial Unemployment Insurance Claims
Meanwhile the Weekly Initial Unemployment Insurance Claims came in at 300,000. For those investors who frequent my website, they know that at 300,000 stocks have never suffered a severe correction with the Weekly Initial Unemployment Insurance Claims this low. So on one hand GDP contracted sharply while the Weekly Initial Unemployment Insurance Claims seemed to point to growth in the economy which supports the theory that the next GDP will be a lot better.
Doom and Gloom
Add to all of this another sharp drop in gold today and in contrast media outlets filled with doom and gloom from analysts and investors calling for a 20% plunge this summer and you can understand the nervousness among investors through much of today.
Market Direction S&P Intraday Chart May 29 2014
The morning open saw a short jump and then a drop back to 1910 shortly after 10:00 AM. As has happened almost this entire year, the period between 10:00 AM to 11:00 AM has been among the best for the Trading For Pennies Strategy. Today was no different with a rally commencing shortly after 10:00 from the 1910 valuation. Shortly after 11:00 the rally ended with stocks trending sideways. The sideways action lasted into the late afternoon when after 2:00 Pm a rally ensued that took the S&P to another all-time closing high at 1920.03. It is of value to remember that quite often new all-time closing highs have been followed by weak days while investors keep taking profits after new highs have been made so we may see weakness tomorrow. We will know more once we look at the technical outlook. 
Advance Declines For May 29 2014
The number of new highs bounced back to 200 today which is a good sign for further possible advances. A true rally that can maintain strength needs to set high new 52 week high numbers usually in excess of 300. We have not seen that since the rally seem to evaporate last December. New lows were down at 62 for the day. 65% of issues were advancing today and just 32% were declining. For volume though, 71% of the volume was up for a total of 1.9 billion shares. 739 million shares were traded to the downside. Total volume was a bit lower today at 2.7 billion and far below Monday’s volume of 4 billion.
Market Direction Closings For May 29 2014
The S&P closed at 1920.03 up 10.25. The Dow closed at 16,698.74 up 65.56. The NASDAQ closed at 4247.95 up 22.87 The IWM Russell small cap ETF was up just 38 cents failing to recover yesterday’s losses. It closed at $113.37.
Market Direction Technical Indicators At The Close of May 29 2014
Let’s review the market direction technical indicators at the close of May 29 2014 on the S&P 500 and view the market direction outlook for May 30 2014. 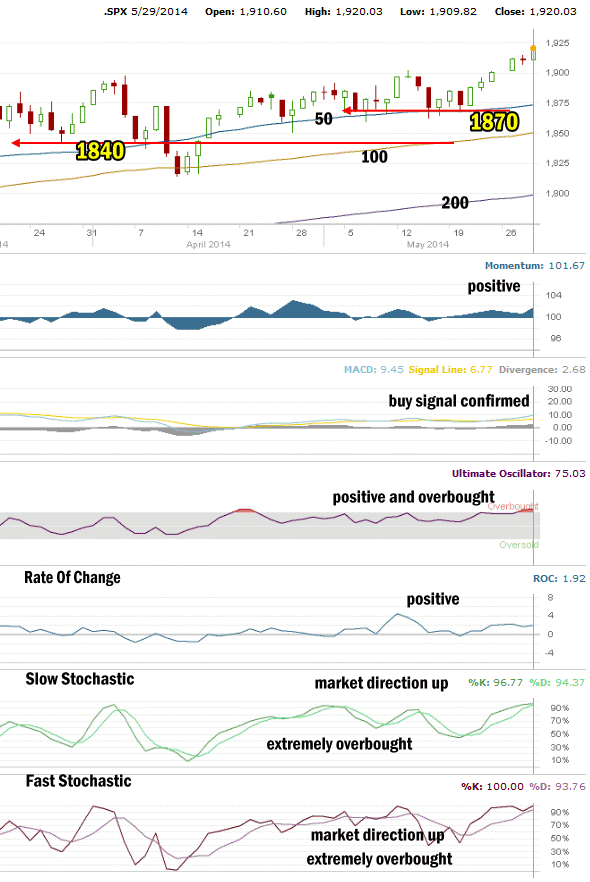 With the market continuing to break into new all-time highs, there are now four key support levels in the market. Long-term support is at 1750. If that level should break at this point, it would mean a significant correction would ensue. The second level of support is at 1775 which again is good support and if it broke would mean that the market direction would quickly collapse down to 1750. These two indicators are good values to use for longer-term trading. As long as stocks stay above these levels, there is no concern the markets will experience any kind of severe pullback.
The next two levels are at 1840 and 1870. At this point with the S&P above 1900, any pull back to 1870 would be a signal to pick up short instruments like the SDOW or SQQQ ETFs or spy put options. If 1870 were breached it would mean a further break lower to at least the 1840 level and for investors it would be a quick and easy trade to pick up short products to enjoy some profits down to 1840. If 1840 were to break at this point it would mean to roll any at the money puts lower and roll down covered calls but only if 1840 were to break. Between 1840 and 1775 there is very little to no support. At this point then, 1870 is actually more important than 1920 for those of us who sell puts for income. The market can wander all it wants but as long as it does not break 1870 then I will be taking advantage of any dips to continue put selling.
Today though with the market direction up to 1920 you can see in the chart above that there is NO support above 1870. But the S&P at 1920 is now 50 points above support. A pullback to 1870 is just 2.6% which is not much of a decline. At some point the S&P will pullback to begin to build some support above 1870. That could happen at any time now.
For Momentum I am using the 10 period. Momentum has been the best indicator over the past five months, replacing MACD as the most accurate indicator. Momentum is positive.
For MACD Histogram, I am using the Fast Points set at 13, Slow Points at 26 and Smoothing at 9. MACD (Moving Averages Convergence / Divergence) issued a buy signal on May 23. Today the buy signal continues to gain strength.
The Ultimate Oscillator settings are Period 1 is 5, Period 2 is 10, Period 3 is 15, Factor 1 is 4, Factor 2 is 2 and Factor 3 is 1. These are not the default settings but are the settings I use with the S&P 500 chart set for 1 to 3 months. The Ultimate Oscillator is continuing positive and remains overbought.
Rate Of Change is set for a 21 period. The rate of change remains positive.
For the Slow Stochastic I use the K period of 14 and D period of 3. The Slow Stochastic is signaling market direction is up and it is extremely overbought.
For the Fast Stochastic I use the K period of 20 and D period of 5. These are not default settings but settings I set for the 1 to 3 month S&P 500 chart when it is set for daily. The Fast Stochastic is signaling that the market direction is up and it too is extremely overbought.
Market Direction Outlook And Strategy for May 30 2014
For the final day of May, the market is now extremely overbought. As explained in the tech notes above, the S&P is 50 points above support at 1870. It is sitting at new all-time highs but with no support except way back at 1870. To build support it will turn lower and see where investors are interested in picking up stocks. That will be the first signal to watch to try to determine where support will be next. With the market direction up now extremely overbought we could see a possible pullback at any time.
What I am doing is looking here and there for stocks that I trade, which have pulled back recently and make good Put Selling or stock trading opportunities. Aside from that I am not chasing any stocks as there is no reason to do so at this point. With the market now over extended and lacking any kind of support, the market direction could shift back down. As well often the new all-time highs have brought in sellers and we could also see that tomorrow as it is the final trading day for the month of May and a Friday.
For Friday then the market direction technical indicators are all pointing to higher valuations but 3 of the 6 indicators are also signaling that the market direction up is overbought. For tomorrow then the outlook is a weak advance but possible pull-back to commence.
Market Direction Internal Links
Profiting From Understanding Market Direction (Articles Index)
Understanding Short-Term Signals
Market Direction Portfolio Trades (Members)