
Historically the day after Memorial Day stocks are higher. At the same time, the final week of May tends to be negative. This should set up the final week to be quite interesting to follow.
Advance Decline Numbers for May 22 2015
Friday was incredibly slow for stocks. Only 2.5 billion shares were traded marking Friday May 22 as one of the lowest this year. Of that volume 64% was to the downside. As well new highs were just 75 and new lows 51.
Market Direction Closings For May 22 2015
The S&P closed at 2,126.06 down 4.76. The Dow closed at 18,232.02 down 53.72. The NASDAQ closed at 5089.36 down 1.43.
Market Direction Technical Indicators At The Close of May 22 2015
Let’s review the market direction technical indicators at the close of May 22 2015 on the S&P 500 and view the market direction outlook for May 26 2015.
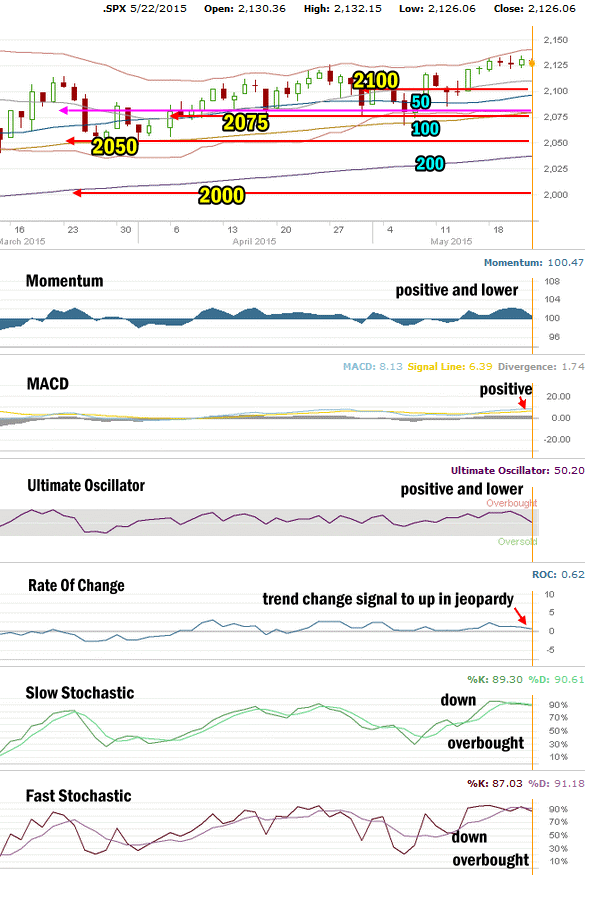
Market Direction Technical Analysis for May 22 2015
Stock Chart Comments:
Friday was a sideways day which saw stocks trade in a narrow range. While stocks closed negative on Friday there were no serious concerns shown in the stock chart.
Support and Resistance Levels:
These are the present support and resistance levels.
2100 is very light support. Stocks will have to stay above it to change it back to solid support and convince investors that the market has staying power and will push well beyond 2100. That still does not appear to be the case.
2075 is light support. Below that is 2050 which is also light support. Stronger support is at 2000 which has repeatedly held the market up throughout each pullback in January and February.
Weak support is at 1970. Stronger support is at 1956.
1870 and 1840 are both levels with strong enough support to delay the market falling and should see a sideways action attempt while investors decide whether to sell or buy.
The other two support levels are 1775 and 1750. I have explained that these two are critical support for the present bull market. While 1775 is important it is 1750 that is the bottom line.
A break of 1750 would mark a severe correction from the most recent high. This would be the biggest correction since April 2012. A pull-back of that size would definitely stun investors and bring to question whether the bull market is finished.
Momentum: For Momentum I am using the 10 period. Momentum is positive but has fallen to the point where it will turn negative if any kind of poor day emerges on Tuesday.
MACD Histogram: For MACD Histogram, I am using the Fast Points set at 13, Slow Points at 26 and Smoothing at 9. MACD (Moving Averages Convergence / Divergence) issued a buy signal on May 14. The buy signal is still being held by the S&P but it is not very strong.
Ultimate Oscillator: The Ultimate Oscillator settings are: Period 1 is 5, Period 2 is 10, Period 3 is 15, Factor 1 is 4, Factor 2 is 2 and Factor 3 is 1. These are not the default settings but are the settings I use with the S&P 500 chart set for 1 to 3 months. The Ultimate Oscillator is positive but pulled back dramatically on Friday and is ready to turn negative.
Rate of Change: Rate Of Change is set for a 21 period. The rate of change moved sideways again on Friday. This could be signaling that the trend change to up is in jeopardy of failing.
Slow Stochastic: For the Slow Stochastic I use the K period of 14 and D period of 3. The Slow Stochastic tries to predict the market direction further out than just one day. The Slow Stochastic is signaling down for stocks and is overbought.
Fast Stochastic: For the Fast Stochastic I use the K period of 20 and D period of 5. These are not default settings but settings I set for the 1 to 3 month S&P 500 chart when it is set for daily. The Fast Stochastic is signaling down for stocks and is very overbought.
Market Direction Outlook for May 26 2015
Historically Tuesday should be an up day. The technical indicators on the other hand have a lot of negative strength. I am expecting a bounce at the open and some strength to be shown. I would then expect stocks to drift lower but I think the market has enough strength to push for a positive close.
Stay FullyInformed With Email Updates
Market Direction Internal Links
Profiting From Understanding Market Direction (Articles Index)
Understanding Short-Term Signals
Market Direction Portfolio Trades (Members)