
Stocks continue to have a lot to contend with but today between the bond market, another poor showing for retail sales and Chinese data that would suggest stimulus measures are falling short of expectations, stocks were treading water all day and closed slightly negative although the NASDAQ managed a very small gain..
Advance Decline Numbers for May 13 2015
Volume moved slightly higher again today reaching 3.4 billion shares. Of that volume 53% was to the upside and 45% to the downside. New highs though were just 53 and new lows were 35.
In general the new highs are not reflective of any kind of move higher for stocks. Instead stocks look set to pullback again.
Market Direction Closings For May 13 2015
The S&P closed at 2,098.48 down 0.64. The Dow closed at 18,060.49 down 7.74. The NASDAQ closed at 4981.69 up 5.50.
Market Direction Technical Indicators At The Close of May 13 2015
Let’s review the market direction technical indicators at the close of May 13 2015 on the S&P 500 and view the market direction outlook for May 14 2015.
Market Direction Technical Analysis for May 13 2015
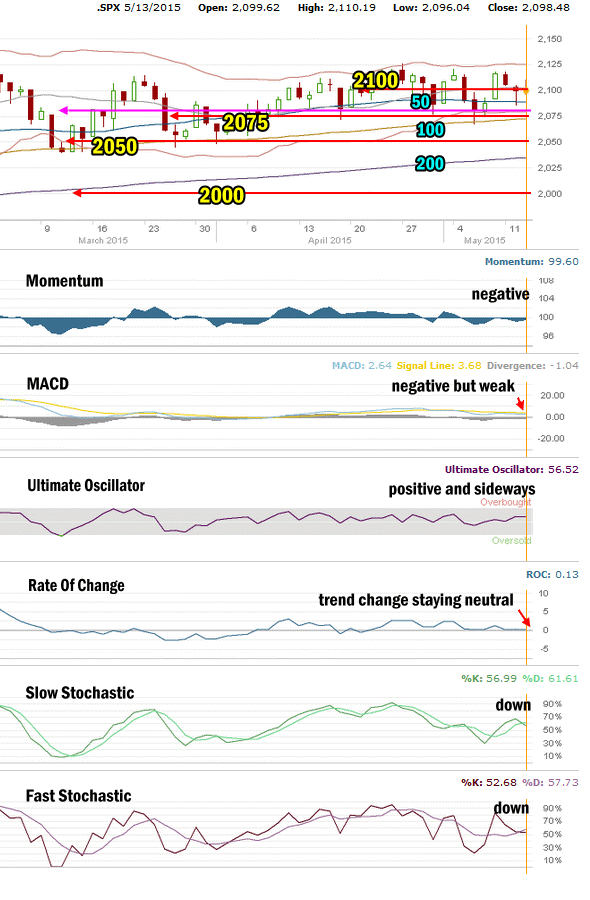
Stock Chart Comments:
The rally in the morning died quickly and by 11:00 the market was down to 2097. The remainder of the day the S&P drifted sideways in a very tight range but by the close it was near the lows of the day. Still though, the decline was minimal. While that may seem significant, the outlook is actually poor unless the bulls can get “something going” on Thursday. Today’s action was very indecisive which most often leads to declines.
Support and Resistance Levels:
These are the present support and resistance levels.
2100 is very light support. Stocks will have to stay above it to change it back to solid support and convince investors that the market has staying power and will push well beyond 2100. That still does not appear to be the case.
2075 is light support. Below that is 2050 which is also light support. Stronger support is at 2000 which has repeatedly held the market up throughout each pullback in January and February.
Weak support is at 1970. Stronger support is at 1956.
1870 and 1840 are both levels with strong enough support to delay the market falling and should see a sideways action attempt while investors decide whether to sell or buy.
The other two support levels are 1775 and 1750. I have explained that these two are critical support for the present bull market. While 1775 is important it is 1750 that is the bottom line.
A break of 1750 would mark a severe correction from the most recent high. This would be the biggest correction since April 2012. A pull-back of that size would definitely stun investors and bring to question whether the bull market is finished.
Momentum: For Momentum I am using the 10 period. Momentum is negative and moving sideways.
MACD Histogram: For MACD Histogram, I am using the Fast Points set at 13, Slow Points at 26 and Smoothing at 9. MACD (Moving Averages Convergence / Divergence) issued a confirmed sell signal on May 5. That signal has been weak since it was confirmed. Today saw another weak negative close in MACD.
Ultimate Oscillator: The Ultimate Oscillator settings are: Period 1 is 5, Period 2 is 10, Period 3 is 15, Factor 1 is 4, Factor 2 is 2 and Factor 3 is 1. These are not the default settings but are the settings I use with the S&P 500 chart set for 1 to 3 months. The Ultimate Oscillator is now positive and moving sideways.
Rate of Change: Rate Of Change is set for a 21 period. The rate of change has signaled a change to the market direction for days now. It would appear that the change in direction may simply be a sideways signal.
Slow Stochastic: For the Slow Stochastic I use the K period of 14 and D period of 3. The Slow Stochastic tries to predict the market direction further out than just one day. The Slow Stochastic is signaling down for stocks.
Fast Stochastic: For the Fast Stochastic I use the K period of 20 and D period of 5. These are not default settings but settings I set for the 1 to 3 month S&P 500 chart when it is set for daily. The Fast Stochastic is signaling down for stocks as well.
Market Direction Outlook for May 14 2015
Yesterday I wrote about the need to stay cautious. Today’s market action is reminiscent of markets on the verge of a break, either lower or higher. Since higher seems to be a lot less likely, it would appear that stocks are set to move lower. Considering that last Friday we saw a terrific bounce back and now we have given back much of the rally, the market appears stuck. With no upside still in the picture for the S&P, the logical outlook is for stocks to move lower.
With volume increasing we are not seeing stocks move higher. This is rarely a good sign for stocks to advance.
The technical indicators are also quite negative. Both stochastics are signaling down, the rate of change is signaling sideways to down, MACD and momentum are both negative, it leaves only the Ultimate Oscillator as the positive indicator and it is trending more sideways than up.
For Thursday then I am expecting stocks to remain weak and for stocks to close lower.
Stay FullyInformed With Email Updates
Market Direction Internal Links
Profiting From Understanding Market Direction (Articles Index)
Understanding Short-Term Signals
Market Direction Portfolio Trades (Members)