
The Market Direction Outlook for Thursday was for markets to attempt a rebound and then close lower. Another large sell-off was not expected. For much of the day it was more sideways than anything else.
Advance Decline for Mar 26 2015
Volume on Thursday was unchanged from Wednesday at 3.5 billion shares. New highs came in at a surprising just 13 and new lows actually no better at just 23. Down volume was 63% and up volume was 36%. Neither bulls or bears won out on Thursday.
Market Direction Closings For Mar 26 2015
The S&P closed at 2,056.15 down 4.90. The Dow closed at 17,678.23 down 40.31. The NASDAQ closed at 4,863.36 down 13.16. All three indexes closed off their lows with just minor percentage losses.
Market Direction Technical Indicators At The Close of Mar 26 2015
Let’s review the market direction technical indicators at the close of Mar 26 2015 on the S&P 500 and view the market direction outlook for Mar 27 2015.
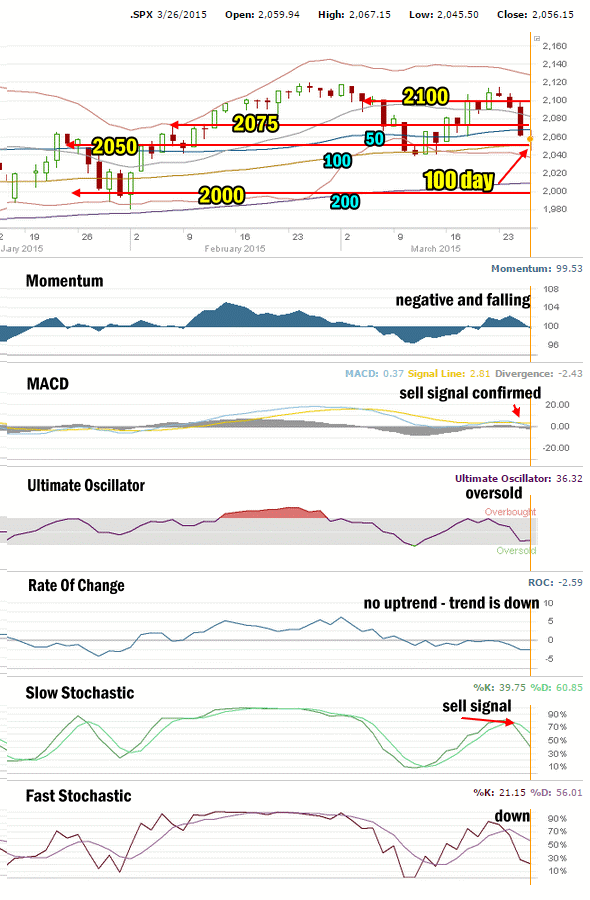
Market Direction Technical Analysis for Mar 26 2015
Stock Chart Comments:
Today the S&P fell through the 100 day exponential moving average (EMA) but then closed back up above it but below the 50 day simple moving average (SMA). The drop to the 100 day should see a bounce and we may have got that bounce today, but there is room for a bigger bounce back attempt. Meanwhile the 2 day simple moving average (SMA) is continuing to turn lower. 2050 is light support but despite this, when the SPX fell below it, investors bought stocks and pushed the market back above 2050.
Support and Resistance Levels:
These are the present support and resistance levels.
2100 was very light support and is now resistance. 2075 is light support. Below that is 2050 which is also light support. Stronger support is at 2000 which has repeatedly held the market up throughout each recent pullback.
Weak support is at 1970. Stronger support is at 1956.
1870 and 1840 are both levels with strong enough support to delay the market falling and should see a sideways action attempt while investors decide whether to sell or buy.
The other two support levels are 1775 and 1750. I have explained that these two are critical support for the present bull market. While 1775 is important it is 1750 that is the bottom line.
A break of 1750 would mark a severe correction from the most recent high. This would be the biggest correction since April 2012. A pull-back of that size would definitely stun investors.
Momentum: For Momentum I am using the 10 period. Momentum is turned negative today and fell lower.
MACD Histogram: For MACD Histogram, I am using the Fast Points set at 13, Slow Points at 26 and Smoothing at 9. MACD (Moving Averages Convergence / Divergence) issued a sell signal on March 25 just two days after a buy signal. The sell signal was confirmed today.
Ultimate Oscillator: The Ultimate Oscillator settings are: Period 1 is 5, Period 2 is 10, Period 3 is 15, Factor 1 is 4, Factor 2 is 2 and Factor 3 is 1. These are not the default settings but are the settings I use with the S&P 500 chart set for 1 to 3 months. The Ultimate Oscillator is now negative and oversold.
Rate of Change: Rate Of Change is set for a 21 period. The Rate Of Change continues to point to a move back to the downside for stocks.
Slow Stochastic: For the Slow Stochastic I use the K period of 14 and D period of 3. The Slow Stochastic tries to predict the market direction further out than just one day. The slow stochastic confirmed yesterday’s sell signal and is pointing lower for stocks.
Fast Stochastic: For the Fast Stochastic I use the K period of 20 and D period of 5. These are not default settings but settings I set for the 1 to 3 month S&P 500 chart when it is set for daily. The Fast Stochastic is also pointing lower for stocks but it is nearing oversold.
Market Direction Outlook for Mar 27 2015
The technical indicators are pointing lower for stocks. There are no indicators pointing higher, however there are two indicators that are very oversold, the Ultimate Oscillator and the Fast Stochastic. Often an oversold reading from these indicators is followed by a bounce back for stocks.
Today we had a bounce, but it wasn’t much of one. While the indicators are all pointing to lower prices for Friday, I think we may see an attempt at a bigger bounce. So with the two technical indicators I mentioned above, pointing to extremely overbought we could see a better attempt to bounce the market, but the overall direction remains lower for stocks.
Stay FullyInformed With Email Updates
Market Direction Internal Links
Profiting From Understanding Market Direction (Articles Index)
Understanding Short-Term Signals
Market Direction Portfolio Trades (Members)