
The Market Direction Outlook for Friday was for stocks to continue to move higher. There is some weakness but overall the direction remained higher on Friday with the NASDAQ back leading the markets higher. The US dollar declined on Friday which helped boost most commodity prices including oil. This played a large roll in the advance as well. If stocks continue to advance eventually it will draw in more capital that has been sitting on the sidelines as investors worry they may miss the next leg up in the rally. So let’s see if there is another leg up still ahead.
Advance Decline for Mar 20 2015
Volume on Friday pushed back close to the 4 billion mark. New highs came roaring back with 271 new 52 week highs. These are the types of numbers investors need to see as proof the rally will continue. New lows came in at just 23.
Market Direction Closings For Mar 20 2015
The S&P closed at 2,108.10 up 18.83. The Dow closed at 18,127.65 up 168.62. The NASDAQ closed at 5026.42 up 34.04.
Market Direction Technical Indicators At The Close of Mar 20 2015
Let’s review the market direction technical indicators at the close of Mar 20 2015 on the S&P 500 and view the market direction outlook for Mar 23 2015.
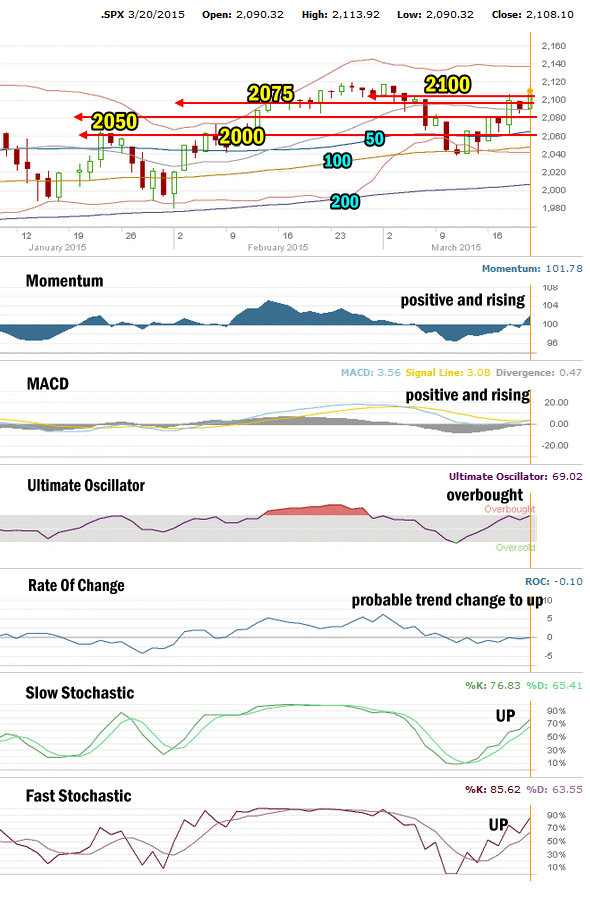
Market Direction Technical Analysis for Mar 20 2015
Stock Chart Comments:
Stocks continued the advance on Friday led higher by the NASDAQ index which is rapidly moving to overcome the highs set 15 years ago during the dot-com bubble. The final hurdle of retaking 2100 is now in play for the S&P. There should be some struggling here but it will eventually overtake it. The three major moving averages are well below the advance.
Support and Resistance Levels:
These are the present support and resistance levels.
2100 was very light support and is now resistance. 2075 is light support. Below that is 2050 which is also light support. Stronger support is at 2000 which has repeatedly held the market up throughout each recent pullback.
Weak support is at 1970. Stronger support is at 1956.
1870 and 1840 are both levels with strong enough support to delay the market falling and should see a sideways action attempt while investors decide whether to sell or buy.
The other two support levels are 1775 and 1750. I have explained that these two are critical support for the present bull market. While 1775 is important it is 1750 that is the bottom line.
A break of 1750 would mark a severe correction from the most recent high. This would be the biggest correction since April 2012. A pull-back of that size would definitely stun investors.
Momentum: For Momentum I am using the 10 period. Momentum is positive and rising.
MACD Histogram: For MACD Histogram, I am using the Fast Points set at 13, Slow Points at 26 and Smoothing at 9. MACD (Moving Averages Convergence / Divergence) issued a buy signal on Friday March 20 which still has to be confirmed, but it is now positive and rising.
Ultimate Oscillator: The Ultimate Oscillator settings are: Period 1 is 5, Period 2 is 10, Period 3 is 15, Factor 1 is 4, Factor 2 is 2 and Factor 3 is 1. These are not the default settings but are the settings I use with the S&P 500 chart set for 1 to 3 months. The Ultimate Oscillator is overbought.
Rate of Change: Rate Of Change is set for a 21 period. The Rate Of Change is back pointing to a change in trend back to up but the Rate Of Change is tending to move more sideways then up and needs to turn up to confirm that this rally higher has quite a bit more to go, otherwise this could be a short rally. This needs to be watched.
Slow Stochastic: For the Slow Stochastic I use the K period of 14 and D period of 3. The Slow Stochastic tries to predict the market direction further out than just one day. The Slow Stochastic is signaling up for stocks for Monday.
Fast Stochastic: For the Fast Stochastic I use the K period of 20 and D period of 5. These are not default settings but settings I set for the 1 to 3 month S&P 500 chart when it is set for daily. The Fast Stochastic is signaling up for stocks for Monday.
Market Direction Outlook for Mar 23 2015
The market direction outlook for Monday is for stocks to continue their advance but there will be some weakness, probably mid-morning as the market begins to enter overbought territory once again. But being overbought in an advance is a good sign and often will draw in new money which this market sorely needs to be able to push a lot higher from here.
For Monday look for weakness around mid-morning (10:30) and then a move to try to close positive again. I’ll be doing an intraday chart analysis on Monday to see how the day is unfolding.
Stay FullyInformed With Email Updates
Market Direction Internal Links
Profiting From Understanding Market Direction (Articles Index)
Understanding Short-Term Signals
Market Direction Portfolio Trades (Members)