
The outlook for Tuesday was for stocks to move sideways but still try to close positive. That however did not happen. The overbought condition the market direction has been in for a while now finally caught up to investors. Today saw investors selling out of the positions. While volume was lower than Monday investors still took advantage of the selling, especially in the afternoon, to follow other investors and sell out of positions.
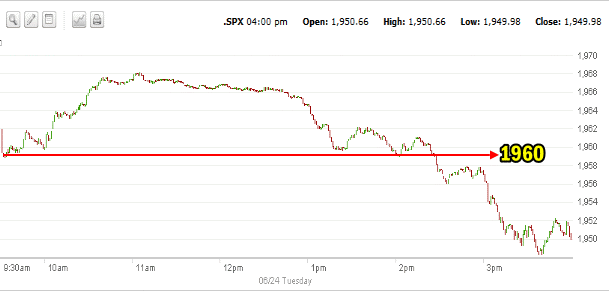
Market Direction S&P Intraday Chart June 24 2014
The one minute chart below shows how the choppy action of the last few days was gone from stocks on Tuesday. The morning saw a wide range rally attempt which pushed to the 1968 level and then began to sell lower. The earning morning dip to 1960 held up until the mid-afternoon when around 2:00 PM the market sold steeply lower. It closed near those lows and I am expecting more selling on Wednesday.
Advance Declines For June 24 2014
The number of stocks making new 52 weeks highs fell below 200 on Tuesday to end the day with 170 new highs. New lows came in at just 18. Volume was a lot lower coming in at 3 billion shares with 77% of the volume on Tuesday, trading lower.
Market Direction Closings For June 24 2014
The S&P closed at 1949.98 down 12.63. The Dow closed at 16,818.13 down 119.13. The NASDAQ closed at 4350.36 down 18.32.
The Russell 2000 IWM ETF closed down $1.26 to $116.76
Market Direction Technical Indicators At The Close of June 24 2014
Let’s review the market direction technical indicators at the close of June 24 2014 on the S&P 500 and view the market direction outlook for June 25 2014.
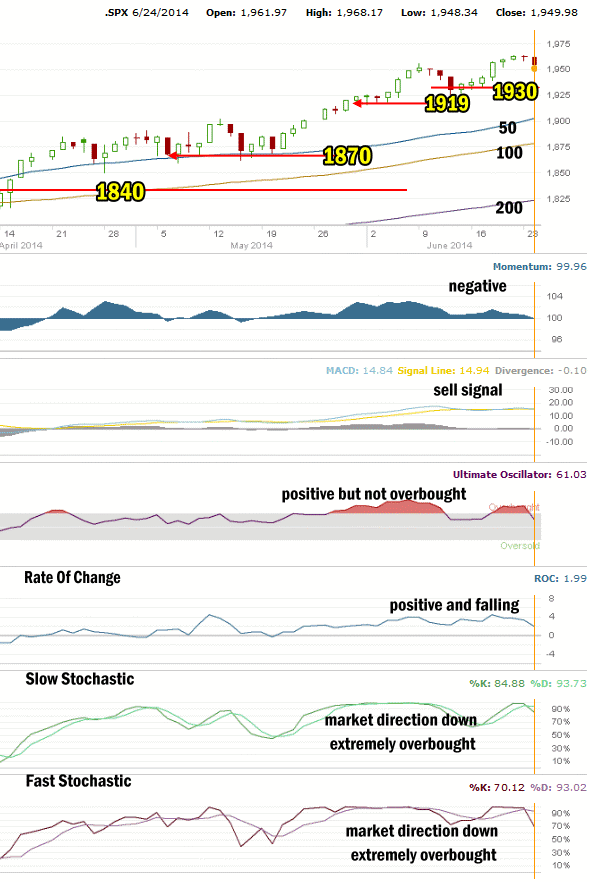
Stock Chart Comments: The drop today in the market has the S&P setup to test the light support level at 1930. I do not think this will hold the market up for more than a day or even half a day. At 1930 there is really no support yet but this is a chance for the S&P to try to establish some support. Personally I think any pullback will work its way down to 1919 fairly easy. That though is just a prediction which is not based on any technical indications at this time.
Instead at present, the market looks ready to tackle the 1930 level and then I can reassess the technical indicators.
Aside from 1930 the support levels are 1919 – which again is light support, 1870 which is strong support, 1840 also strong support. Those two support levels, 1870 and 1840 at present mark important trading levels for investors. Both are now below the 100 day exponential moving average (EMA) so any pullback this summer which breaks 1870 should be used as a signal to commence picking up ultra short ETFs or spy put options 2 months out for a move lower. A break below 1840 at present would challenge the 200 day EMA however at the rate the market is moving higher the 1840 and 1870 will soon be below the 200 day EMA which is sitting around 1820 at present.
I have repeatedly mentioned two other support levels, namely 1775 and 1750. Both are critical support levels. 1775 is important but 1750 is now the bottom line. A break of that would mark a severe correction of 10.5% at present which would be the biggest correction since April 2012. A pull-back of that size would definitely stun investors at this point and it is not something I an anticipating as there are no signs of any impending correction.
My Pullback Outlook: I have been waiting for a pull-back this summer to between 1870 to 1919 and so far this might be the best sign to date but still we need to see more selling and definitely higher volume before labeling this the pullback I have waited for.
Momentum: For Momentum I am using the 10 period. Momentum has been the best indicator over the past eight months, replacing MACD as the most accurate indicator. Momentum is slightly negative but really more neutral than anything.
MACD Histogram: For MACD Histogram, I am using the Fast Points set at 13, Slow Points at 26 and Smoothing at 9. MACD (Moving Averages Convergence / Divergence) issued a buy signal on June 18. Today MACD issued a weak sell signal.
Ultimate Oscillator: The Ultimate Oscillator settings are: Period 1 is 5, Period 2 is 10, Period 3 is 15, Factor 1 is 4, Factor 2 is 2 and Factor 3 is 1. These are not the default settings but are the settings I use with the S&P 500 chart set for 1 to 3 months. The Ultimate Oscillator is still positive but no longer overbought falling dramatically today.
Rate of Change: Rate Of Change is set for a 21 period. The rate of change remains positive but is now trending lower.
Slow Stochastic: For the Slow Stochastic I use the K period of 14 and D period of 3. The Slow Stochastic is signaling market direction is down and it is extremely overbought.
Fast Stochastic: For the Fast Stochastic I use the K period of 20 and D period of 5. These are not default settings but settings I set for the 1 to 3 month S&P 500 chart when it is set for daily. The Fast Stochastic is signaling that the market direction is down and it too is now extremely overbought.
Market Direction Outlook And Strategy for June 25 2014
For Wednesday we can see that today’s technical indicators are turning lower and following quite a few days of positive readings, we now have quite a few negative readings. This indicates that stocks will pullback further on Wednesday. While we could see a rally in the morning near the open, it is questionable how long any really has to last at present.
I am expecting more selling to emerge on Wednesday for the S&P. We could see a rally attempt at the outset but the market looks tired and a rest may be just what is needed at this stage.
Market Direction Internal Links
Profiting From Understanding Market Direction (Articles Index)
Understanding Short-Term Signals
Market Direction Portfolio Trades (Members)