
FullyInformed.com
Generic filters

Market Direction Outlook For June 1 2015 – More Weakness and Lower

May 31, 2015 | Stock Market Outlook

Friday’s outlook was for more weakness in stocks, poor volumes and a lower closer. By the end of the day stocks were in the red but volume finally moved higher. The GDP contracted 0.7 percent annualized disappointing the outlook for a gain of 0.2 percent. Investors are starting to pay attention to the transportation index as it continued to slide on Friday. It is now within easy reach of entering a full correction as the index is almost 10 percent below its 2014 high.

Advance Decline Numbers for May 29 2015

One of the best days for New York trading was on Friday with 4 billion shares traded. Of that volume 70% was to the downside and 29% to the upside. Only 49 new highs were recorded but 60 new lows.

The decline off the most recent all-time highs has grabbed the attention of investors and on Friday the pullback drew in my investors. This may bleed over into the start of June.

Market Direction Closings For May 29 2015

The S&P closed at 2,107.39 down 13.40. The Dow closed at 18,010.68 down 115.44. The NASDAQ closed at 5,070.03 down 27.95.

Market Direction Technical Indicators At The Close of May 29 2015

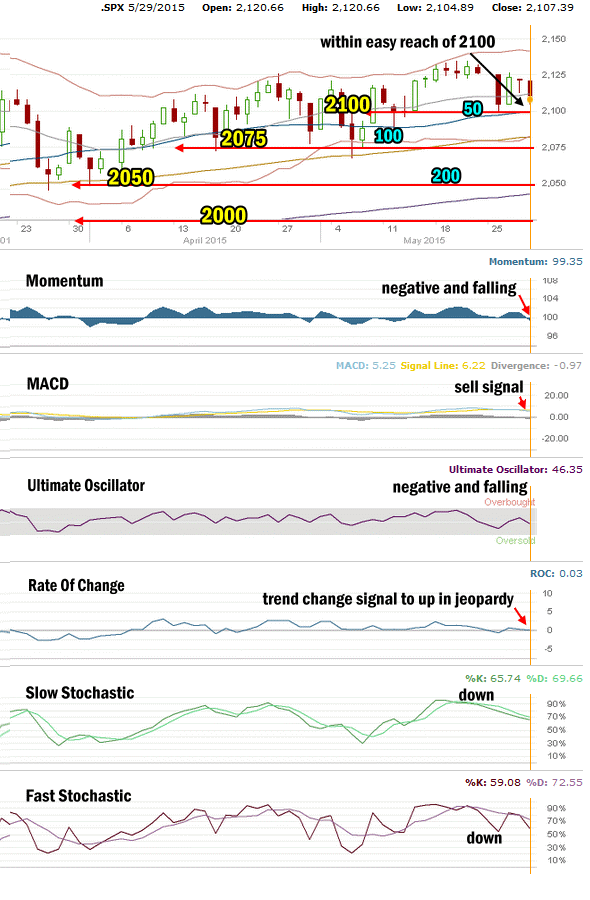
Let’s review the market direction technical indicators at the close of May 29 2015 on the S&P 500 and view the market direction outlook for June 1 2015.
Market Direction Technical Analysis for May 29 2015

Market Direction Technical Analysis for May 29 2015

Stock Chart Comments:

The drop on the S&P on Friday placed it within easy reach of falling below 2100 which would place it below the 50 day moving average.

Support and Resistance Levels:

These are the present support and resistance levels.

2100 is very light support. Stocks will have to stay above it to change it back to solid support and convince investors that the market has staying power and will push well beyond 2100. That still does not appear to be the case.

2075 is light support. Below that is 2050 which is also light support. Stronger support is at 2000 which has repeatedly held the market up throughout each pullback in January and February.

Weak support is at 1970. Stronger support is at 1956.

1870 and 1840 are both levels with strong enough support to delay the market falling and should see a sideways action attempt while investors decide whether to sell or buy.

The other two support levels are 1775 and 1750. I have explained that these two are critical support for the present bull market. While 1775 is important it is 1750 that is the bottom line.

A break of 1750 would mark a severe correction from the most recent high. This would be the biggest correction since April 2012. A pull-back of that size would definitely stun investors and bring to question whether the bull market is finished.

Momentum: For Momentum I am using the 10 period. Momentum is negative and falling.

MACD Histogram: For MACD Histogram, I am using the Fast Points set at 13, Slow Points at 26 and Smoothing at 9. MACD (Moving Averages Convergence / Divergence) issued a stronger sell signal on Friday but it has to be confirmed.

Ultimate Oscillator: The Ultimate Oscillator settings are: Period 1 is 5, Period 2 is 10, Period 3 is 15, Factor 1 is 4, Factor 2 is 2 and Factor 3 is 1. These are not the default settings but are the settings I use with the S&P 500 chart set for 1 to 3 months. The Ultimate Oscillator is negative and falling.

Rate of Change: Rate Of Change is set for a 21 period. The rate of change moved up just slightly today. It is still signaling that the latest trend up is changing to down.

Slow Stochastic: For the Slow Stochastic I use the K period of 14 and D period of 3. The Slow Stochastic tries to predict the market direction further out than just one day. The Slow Stochastic is still signaling down for stocks.

Fast Stochastic: For the Fast Stochastic I use the K period of 20 and D period of 5. These are not default settings but settings I set for the 1 to 3 month S&P 500 chart when it is set for daily. The Fast Stochastic is signaling down for stocks.

Market Direction Outlook for June 1 2015

The final trading day of May saw stocks close near the lows but off of them. That should set Monday morning up for a bounce back attempt from the open. However the technical indicators are moving overwhelmingly negative. With the S&P ready to quickly fall below 2100 and the Dow set to close below 18,000 (again), stocks should lose what I am expecting to be a short-lived early morning rally on Monday and then close lower to start June.

Stay FullyInformed With Email Updates

    Your First Name (required)

    Your Email (required)

    Anti-Spam: Please Answer This Math Question

    I will send you a reply to confirm that you want to subscribe before sending any emails.


    Market Direction Internal Links

    Profiting From Understanding Market Direction (Articles Index)

    How I Use Market Timing

    How I Use Market Timing

    Understanding Short-Term Signals

    Various Market Timing Systems

    Market Direction Portfolio Trades (Members)

    Market Direction External Links

    Market Direction

    IWM ETF Russell 2000 Fund Info

    Market Direction SPY ETF 500 Fund Info

    Recent Outlooks

    Stock Market Outlook For Fri Aug 21 2026 – Unconfirmed MACD Down Signal

    Prior Trading Day Summary On Thu Aug 20 2026 stocks moved lower as bond yields rose again despite the efforts of Treasury Secretary Bessent to calm bond markets.  days is anyone’s guess. The SPX ended the day down 66 points …

    Morning Investing Strategy Notes for Thu Aug 20 2026

    For FullyInformed Members the morning Investing Strategy Notes for Thu Aug 20 2026 discuss the outlook for stocks after Wednesday’s slightly higher close. There are a number of equity trades today. Stocks include Nordson Corp Stock (NDSN), Walmart Stock (WMT), …

    Stock Market Outlook For Thu Aug 20 2026 – Bounce Likely But Weakness Continues

    Prior Trading Day Summary On Wed Aug 19 2026 stocks regained their footing when Treasury Secretary Bessent announced doubling long-bond buybacks to try to stop rising bond rates. For the day it worked and bond yields dipped lower but whether …

    Morning Investing Strategy Notes for Wed Aug 19 2026

    For FullyInformed Members the morning Investing Strategy Notes for Wed Aug 19 2026 discuss the outlook for stocks after two days of losses. There are a number of equity trades today. Stocks include Toll Brothers Stock (TOL), Wells Fargo Stock …

    Stock Market Outlook For Wed Aug 19 2026 – Weakness and Lower – FOMC Minutes

    Prior Trading Day Summary On Tue Aug 18 2026 with oil prices rising and bond yields rising to level not seen in two decades, stocks couldn’t hold their recent gains. The SPX ended the day down 53 points to close …

    Morning Investing Strategy Notes for Tue Aug 18 2026

    For FullyInformed Members the morning Investing Strategy Notes for Tue Aug 18 2026 discuss the outlook for stocks following a second down day on Monday. There are a number of equity trades today. Stocks include Wells Fargo Stock (WFC), SMH …

    Stock Market Outlook For Tue Aug 18 2026 – Weakness With Dips

    Prior Trading Day Summary On Mon Aug 17 2026 stock indexes ended the day slightly lower as investors attention returned to the Iran conflict and rising bond yields. The SPX ended the day down 40 points to close at 7745 …

    Morning Investing Strategy Notes for Mon Aug 17 2026

    For FullyInformed Members the morning Investing Strategy Notes for Mon Aug 17 2026 discuss the prior week and the outlook for the third week of August for equities. There are a number of equity trades today. Stocks include Home Depot …

    Stock Market Outlook For Mon Aug 17 2026 – Dips Likely But Higher Close

    Prior Trading Day Summary On Fri Aug 14 2026 the stocks saw further weakness with both the S&P and NASDAQ ending in the red. The SPX ended the day down 18 points to close at 7780. Intraday the SPX saw …

    Morning Investing Strategy Notes for Fri Aug 14 2026

    For FullyInformed Members the morning Investing Strategy Notes for Fri Aug 14 2026 review the rally on Thursday. There are a number of equity trades today. Stocks include Netflix Stock (NFLX), Western Digital Stock (WDC), International Business Machines Stock (IBM) …

    Stock Market Outlook For Fri Aug 14 2026 – Bullish – New Highs

    Prior Trading Day Summary On Thu Aug 13 2026 the July PPI numbers came in more “tame” than many analysts were predicting. Stocks moved higher as a result. The SPX ended the day up 50 points to close at 7798, …

    Morning Investing Strategy Notes for Thu Aug 13 2026

    For FullyInformed Members the morning Investing Strategy Notes for Thu Aug 13 2026 review the market action on Wednesday. There are a number of equity trades today. Stocks include ARM Stock (ARM), Cisco Stock (CSCO), Tapestry Inc Stock (TPR), Applied …

    Stock Market Outlook For Thu Aug 13 2026 – Mixed Outlook For Second Day Ahead Of PPI Numbers

    Prior Trading Day Summary On Wed Aug 12 2026 the July CPI numbers came in as estimated but did not show inflation is taking off. Stocks tried to rally off the news but with the latest PPI numbers due of …

    Morning Investing Strategy Notes for Wed Aug 12 2026

    For FullyInformed Members the morning Investing Strategy Notes for Wed Aug 12 2026 review the outlook for Wed Aug 12 2026 with the release of the July CPI numbers. There are a number of equity trades today. Stocks include Coreweave …

    Subscribe For The Latest News