
The market direction outlook for Wednesday was for stocks to move lower. The short-term outlook which goes beyond one day, is for the SPX to probably try to retest 1956. Today for example the SPX fell down to 1962.42 before pushing back up. The stronger GDP numbers, I think, were in the cards. The employment numbers have continually showed strength building for more than a few weeks now. While the GDP coming in at 4% was beyond what most expected, myself included, it continues to show what the employment numbers have been telling us. On Thursday we get the Weekly Initial Unemployment Insurance Claims which should be interesting to view. The participation rate is an area that interests me quite a lot as I think it could hold the key to timing for the Fed to raise interest rates.
UPS Stock and FEDEX Stock
To follow up on my look at Fedex and UPS stocks from yesterday. Both stocks recovered today with UPS up 49 cents to $99.35 for a half percent gain. Fedex meanwhile had a jump of 1.51% gaining $2.22 to close at $149.36. You can see in the Fedex chart below that the stock was outside the Lower Bollinger Band yesterday and today moved back inside. MACD is still negative but the Ultimate Oscillator shows that the stock was deeply oversold so a bounce was somewhat expected.
While this looks like a promising rebound trade, I am not trading the stock at present. I stopped trading the stock at around $125.00 and turned the capital I was using in Fedex Stock over to Visa Stock.
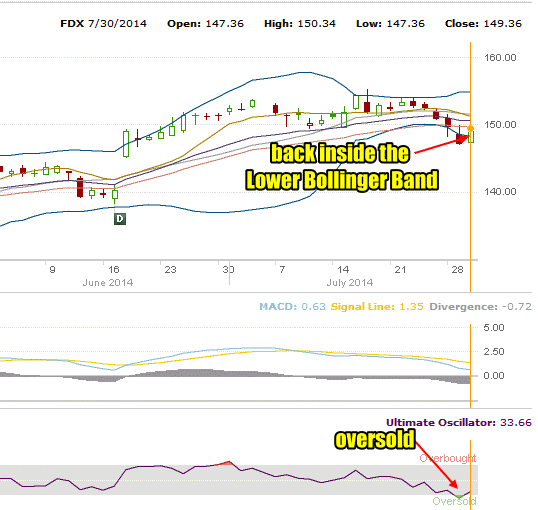
Fedex Stock to July 30 2014
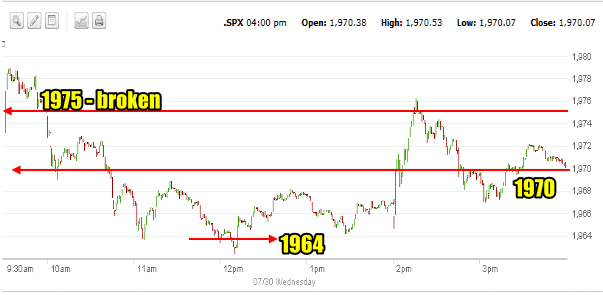
Market Direction S&P Intraday Chart July 30 2014
The one minute chart for the SPX for today shows the extent of the selling that occurred fairly steady into the lunch hour. The morning saw the market jump back above 1975 and then quickly fall through it. This is the second day with the 1975 level broken and for the present time may end 1975 as light support. The more important support is down at 1956.
In the morning 1970 was tested and it too broke as selling intensified.
The morning selling saw volumes beginning to pick up for the first time in a few days. This helped to push the SPX down below 1964. When that level held, the S&P pushed back up with investors carefully selecting which stocks to pick up. By around 2:30 the S&P had pushed all the way back to 1975. That quickly ended and the final two hours was spent with the market drifting lower and finally closing at 1970.
Advance Declines For July 30 2014
Today volumes picked up again with almost 3.5 billion shares traded. Of that volume, 53% was to the downside with 45% to the upside. Of issues trading 59% were trading lower with 37% trading higher.
New lows remained almost unchanged from Tuesday with 48 new lows. New highs were also almost unchanged at 84 versus yesterday’s 88.
Despite the selling today, the new highs and new lows are almost unchanged which shows that investors in general are still committed to this market and believe stocks have a better chance of moving higher rather than lower. With the action today, there should have been a marked increased in new lows if the consensus was starting to shift to the downside for most investors. This was not the case. It was a weak day for stocks but in general the uptrend is still with stocks at present.
Market Direction Closings For July 30 2014
The S&P closed at 1970.07 up just 0.12 on the day and still holding the 1970 level. The Dow closed at 16,880.36 down 31.75 and below 16900 but well off the lows of the day. At this point, recovering 16900 and then 17000 should still be easily doable if investors start to push higher again. The NASDAQ closed at 4462.90 up 20.20.
The Russell 2000 IWM ETF closed up again today with a gain of 45 cents to $113.79. These are not huge gains the last two days but they could be signaling that stocks are stronger than a lot of analysts perceive.
Market Direction Technical Indicators At The Close of July 30 2014
Let’s review the market direction technical indicators at the close of July 30 2014 on the S&P 500 and view the market direction outlook for July 31 2014.
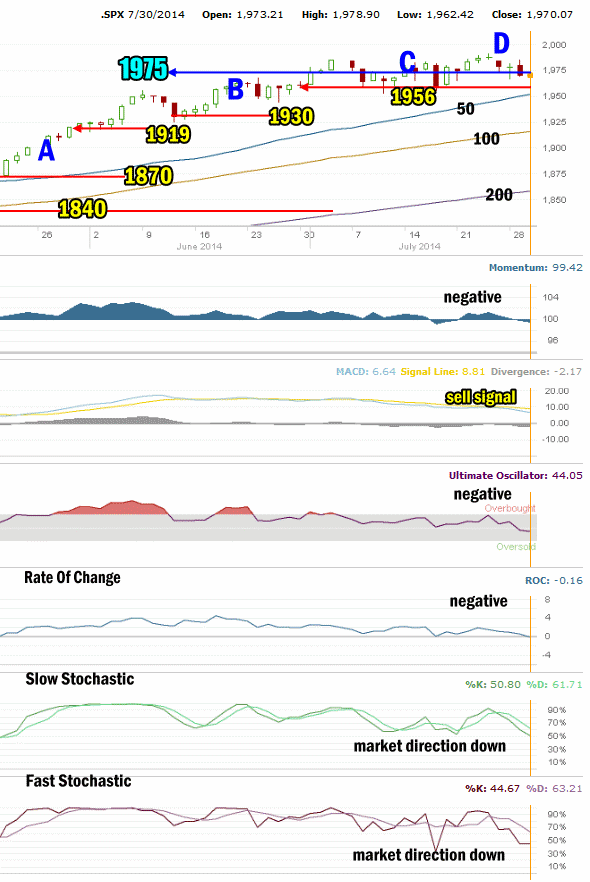
Stock Chart Comments: I have been commenting for more than a week now regarding the past chart patterns of the various dips in the S&P over the past 3 months. I have marked these in the chart above as A, B and C. The period marked D is where stocks are at present.
You can clearly see now that the pattern of A,B and C periods in the SPX chart are not being repeated now. Instead the index is continuing to pullback. It is not however making any kind of new lower low so until that happens, this is still only a period of weakness and I am trading at present with the anticipation that this is indeed just weakness and the SPX will shortly move higher.
1975 Support: There is a new support level developing at 1975 in the S&P. I have marked it in the chart above. It is very light support and was broken through yesterday and again today it failed to hold the market up.
1956 Support Level has been tested in the past and has become a significant support level for the present rally. A close back below 1956 would end the present rally and I would trade to the downside. 1956 is NOT a significant support level for the bull market in general but it is for the market being able to continue higher into August.
Support levels at present are 1956 which is medium support and pivotal to the market direction continuing higher. 1930 and 1919 are both light support and would most likely just delay a strong pullback by a day at most. 1870 and 1840 are strong support. 1870 and 1840 at present mark important trading levels for investors. Both are now below the 100 day exponential moving average (EMA) so any pullback this summer which breaks 1870 should be used as a signal to commence picking up ultra short ETFs or spy put options 2 months out for a bigger move lower. A break below 1840 at present would challenge the 200 day EMA.
The other two support levels not shown in the chart above are 1775 and 1750. As the market continues to push higher, these are now absolutely critical support levels. 1775 is important but 1750 is now the bottom line. A break of 1750 would mark a severe correction of 230 points which is below a 10% correction which would be the biggest correction since April 2012. A pull-back of that size would definitely stun investors at this point and it is not something I am anticipating as there are no signs of any impending correction of that magnitude.
My Pullback Outlook: I have been waiting for a pull-back this summer to between 1870 to 1919. While media outlets continue to write about an impending crash, and indeed eventually they will be right, but at the present time there are far too many bearish investors for a major correction. .
Instead what we might see is additional weakness and higher volatility. That too would assist in driving up option premiums. The market though may try to push through August without much in the way of a correction. At present, I will be watching the S&P to see if it tries to make a new high and fails. If that should happen in August, then the market direction is definitely going to change to lower. This will be key element to watch for the next several days and possibly a couple of weeks.
Momentum: For Momentum I am using the 10 period. Momentum has been the best indicator, replacing MACD as the most accurate indicator. Momentum is now negative. Momentum continues to move lower into negative readings today.
MACD Histogram: For MACD Histogram, I am using the Fast Points set at 13, Slow Points at 26 and Smoothing at 9. MACD (Moving Averages Convergence / Divergence) issued sell signal on July 8 and the sell signal is still active and stubbornly refuses to move positive. This means that for almost the entire month of July MACD has been negative and refuses to support the push higher for the S&P. Today MACD moved to stronger negative readings.
Ultimate Oscillator: The Ultimate Oscillator settings are: Period 1 is 5, Period 2 is 10, Period 3 is 15, Factor 1 is 4, Factor 2 is 2 and Factor 3 is 1. These are not the default settings but are the settings I use with the S&P 500 chart set for 1 to 3 months. The Ultimate Oscillator fell slightly lower today and stayed negative.
Rate of Change: Rate Of Change is set for a 21 period. The rate of change is for the first time in weeks, negative.
Slow Stochastic: For the Slow Stochastic I use the K period of 14 and D period of 3. As the Slow Stochastic tries to predict the market direction further out than just one day. The Slow Stochastic has been issuing down signals since Friday. Today’s signal is not quite as strong as yesterday but it is still solidly negative.
Fast Stochastic: For the Fast Stochastic I use the K period of 20 and D period of 5. These are not default settings but settings I set for the 1 to 3 month S&P 500 chart when it is set for daily. The Fast Stochastic at the close continues to show a down signal but like the Slow Stochastic the signal is weaker than yesterday.
Market Direction Outlook And Strategy for July 31 2014
The market is technically heavily weighted to the downside but there are signs the selling at the moment may slow. Both the Fast Stochastic and Slow Stochastic have weaker sell signals than yesterday and while MACD continues to show more strength to the downside, the Rate Of Change is only mildly negative and the Ultimate Oscillator is negative but trending sideways rather than lower.
Stocks remain above the critical 1956 level for stocks and even with the S&P down to just below 1964, stocks managed to push back and close up at 1970 again. At present while the market direction remains clearly lower there are signs that the selling is slowing. This could mean the market is setting up to move back up. As long as the market stays above 1956 the uptrend remains intact. If however it closes below 1956, it will mark a change in the short-term trend for stocks.
At present I am starting to close some further out of the money naked puts that have good profits but can be closed for 50% or better profits. At this point while the direction is down as far as the technical indicators are concerned, I won’t be surprised if stocks push higher after a weak open for Thursday.
For Thursday, the final day of July, the technical indicators point to stocks continuing lower on the SPX. Historically the NASDAQ has been lower 7 of the last 8 years on July 31.
Stay FullyInformed With Email Updates
Market Direction Internal Links
Profiting From Understanding Market Direction (Articles Index)
Understanding Short-Term Signals
Market Direction Portfolio Trades (Members)