
I had expected the market direction to move higher into the close. The early morning weakness was expected but stocks looked like they wanted to squeeze out a gain by lunch hour. In the end though this did not happen and stocks pulled back slightly to end the day with a small loss for the SPX, Dow but a gain for the NASDAQ. After hours, news came in that Chinese manufacturing had expanded at the fastest pace to date in 2014 with stats from the National Bureau of Statistics and China Federation of Logistics and Purchasing indicating that the purchasing managers’ index for June was 51.0, a rise from prior months and indicative of the economy beginning to pick up. However it has to be said that data from Chinese sources is often difficult to ascertain its accuracy.
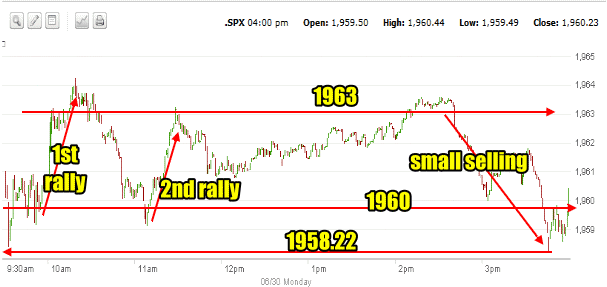
Market Direction S&P Intraday Chart June 30 2014
The one minute intraday chart for Monday June 30 shows the very tight range stocks traded in for most of the day. Most stocks traded with a high of 1963 and a low around 1960. The morning saw two rallies each of which I did a Trading For Pennies Strategy trade on the SPY PUT against. The second rally was not as high as the first but the selling which resulted from the second rally did not push the SPX very low. From there stocks rallied again although they still failed to take out the very first morning rally high. This though seemed to suggest investors would see a positive close. However once the 2:30 rally seemed to end without breaking the early morning high, some sellers stepped in and pushed the SPX back to the low of the day at 1958.22. This sparked a very small bounce back allowing the SPX to close at 1960.23. The most important thing we saw on Monday though was a very tight trading range for most of the day and a close once again above 1956. The 1956 level is becoming pivotal for this latest rally to try to make new highs.
Advance Declines For June 30 2014
The number of stocks making new 52 weeks highs was once again above 200 with 256 new highs and only 5 new lows. Volume though was light at around 3 billion shares. 58% of stocks were advancing while 38% were declining. This was a drop of a billion shares from Friday to Monday.
Market Direction Closings For June 30 2014
The S&P closed at 1960.23 down just 0.73. The Dow closed at 16,826.60 down 25.54. The NASDAQ closed at 4408.18 up 10.25.
The Russell 2000 IWM ETF closed up 47 cents to $118.81.
Market Direction Technical Indicators At The Close of June 30 2014
Let’s review the market direction technical indicators at the close of June 30 2014 on the S&P 500 and view the market direction outlook for July 1 2014.

Stock Chart Comments: There is nothing new to report on the stock chart. A new support level is developing in the S&P. You can see how support is starting to build at the 1956 level. Each day that stocks close back above 1956 is slowly building light support. This may not last and it certainly won’t hold the market up at the present time but it is encouraging for the bulls to see more sideways action with a bias to the upside.
Support levels at present are 1930 and 1919 which are light support. 1870 and 1840 are strong support. 1870 and 1840 at present mark important trading levels for investors. Both are now below the 100 day exponential moving average (EMA) so any pullback this summer which breaks 1870 should be used as a signal to commence picking up ultra short ETFs or spy put options 2 months out for a move lower. A break below 1840 at present would challenge the 200 day EMA however at the rate the market is moving higher the 1840 and 1870 will soon be below the 200 day EMA which is sitting around 1825 at present.
I have repeatedly mentioned two other support levels, namely 1775 and 1750. As the market continues to push higher, these are now critical support levels. 1775 is important but 1750 is now the bottom line. A break of 1750 would mark a severe correction of 10.5% at present which would be the biggest correction since April 2012. A pull-back of that size would definitely stun investors at this point and it is not something I am anticipating as there are no signs of any impending correction of that magnitude.
My Pullback Outlook: I have been waiting for a pull-back this summer to between 1870 to 1919 but again today’s buying into the close continues to point to investors unwilling to part with their shares at the present time. Investors are fairly convinced stocks will move higher and with the next earnings season about to start, investors will probably be fairly reluctant to sell this week unless a strong catalyst to the downside emerges.
Momentum: For Momentum I am using the 10 period. Momentum has been the best indicator over the past eight months, replacing MACD as the most accurate indicator. Momentum is positive.
MACD Histogram: For MACD Histogram, I am using the Fast Points set at 13, Slow Points at 26 and Smoothing at 9. MACD (Moving Averages Convergence / Divergence) issued a sell signal on June 24. That sell signal remains active but weak.
Ultimate Oscillator: The Ultimate Oscillator settings are: Period 1 is 5, Period 2 is 10, Period 3 is 15, Factor 1 is 4, Factor 2 is 2 and Factor 3 is 1. These are not the default settings but are the settings I use with the S&P 500 chart set for 1 to 3 months. The Ultimate Oscillator is still positive and moving sideways. It is not overbought.
Rate of Change: Rate Of Change is set for a 21 period. The rate of change remains positive but continues to move lower.
Slow Stochastic: For the Slow Stochastic I use the K period of 14 and D period of 3. The Slow Stochastic is signaling market direction is up and it is overbought.
Fast Stochastic: For the Fast Stochastic I use the K period of 20 and D period of 5. These are not default settings but settings I set for the 1 to 3 month S&P 500 chart when it is set for daily. The Fast Stochastic is signaling that the market direction is up and it too is overbought.
Market Direction Outlook And Strategy for July 1 2014
There is no change in the outlook at the present time. The technical indicators are unchanged from Friday with only one indicator showing a negative outlook. Several indicators are starting to turn a bit lower, such as the Rate Of Change but even it is not yet at a point where I would think the market will pull back. This is a short week as Friday is independence day and often stocks move higher historically in the days leading to July 4.
As well today was the final trading day of June and often fund managers and investors of all sizes tend to make adjustments to their portfolios for the coming month, which results in a sideways kind of day, which is what we saw on Monday.
For Tuesday the TSX is closed in Canada for Canada Day. I will be writing up the TSX market direction for Wednesday, tomorrow. Meanwhile just to remind investors about the July Trends, here is that information again.
July Trends
While July falls within the worst 6 months of the year for stocks, it is the best month of the worst 6 months. Historically the Dow has been up the first day of July in 19 of the last 24 years. In general July tends to be positive for stocks although for whatever reasons, the NASDAQ does not fare well in July. usually ending the month weaker than it started.
But these are historic facts which can change easily in a year such as the one we are presently in. With the S&P now finally up about 6 percent for the year investors in general are reluctant to sell shares here and believe that stocks are heading higher. July could therefore end up being a good month for stocks.
For Tuesday – Still Sideways Bias Up
For Tuesday the stock market direction for the S&P is unchanged at sideways with a bias up. Based on the technical indicators and the historic data for July, everything points to a higher close for Tuesday.
Market Direction Internal Links
Profiting From Understanding Market Direction (Articles Index)
Understanding Short-Term Signals
Market Direction Portfolio Trades (Members)