
Nothing seems to move markets like the Federal Reserve can. Today was another perfect example. Investors felt the Fed would be more “understanding” of the stock market and give some indication they would hold on further interest rate increases. Instead the Fed remined dovish to a degree and did indicate they see a possible change to moderate growth but didn’t indicate they would stop further interest rate increases. Investors dumped shares and the market tanked.
Index Closing Prices
All the indexes closed off their lows. The S&P closed at 1,882.95 down 20.68 but above the important 1880 support level. The Dow Jones closed at 15,944.46 down 222.77. The NASDAQ closed at 4,468.17 down 99.5 points wiping out double yesterday’s gain.
Advance Decline Numbers
Volume on Wednesday came in at 4.76 billion with 54% of all volume moving lower and 45% higher. There were only 52 new lows which is down from yesterday’s 74 and 26 new highs up slightly from yesterday.
These numbers point to the plunge on Wednesday following the Fed’s comments as more a knee-jerk type reaction. The number of new lows has been dropping off all week. Thursday should see the markets recover based on the above numbers.
Market Direction Technical Indicators At The Close
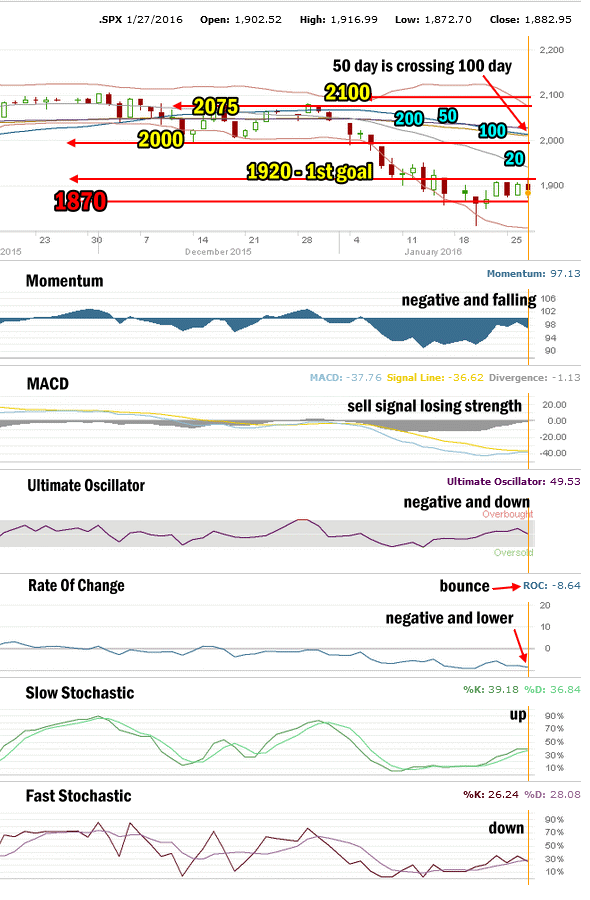
SPX Market Direction Technical Analysis for Jan 27
Stock Chart Comments:
The collapse today has pushed the 50 day simple moving average (SMA) to the 100 day moving average. It may cross down and over the 100 day on Thursday or Friday depending on the market movement. Meanwhile even with today’s drop the S&P is still in a sideways pattern holding the 1880 level. The first goal of 1920 still needs to be taken. 1870 has no been broken or even tested again at this point. The 200 day moving average is still leading the market.
Support and Resistance Levels:
These are the present support and resistance levels. These levels have not changed since January 2015. 2100 was light support. Stocks have been unable to stay above this level. It remains resistance.
2075 was light support and is also resistance. Below that is 2050 which was also light support and now resistance.
Stronger support was at 2000 which is now resistance.
Weak resistance is at 1970 while stronger resistance is at 1956 and technically it is more important than 1970 for the market. 1940 was light support and is now resistance. 1920 was light support and is also resistance. 1900 is more symbolic than anything else.
1870 and 1840 are still trying to support the markets but sellers will easily be able to overcome these technical support levels should selling erupt again. 1820 is light support.
1775 and 1750 are both critical support for the present bull market. While 1775 is important it is 1750 that is the bottom line.
A break of 1750 would mark a severe correction from the all-time high of 2134.72. This would be the biggest correction since 2011 plunge of 271 points for a 20% pullback. A pullback to 1750 from the all-time high would be a drop of 384 points for a decline of 18%. A pull-back of that size would definitely stun investors and bring to question whether the bull market is finished.
Momentum: For momentum I use a 10 period when studying market direction. Momentum is negative and falling back.
MACD Histogram: For MACD Histogram, I am using the Fast Points set at 13, Slow Points at 26 and Smoothing at 9. MACD (Moving Averages Convergence / Divergence) issued a sell signal on Jan 4. The sell signal continued to weaken again on Wednesday and is barely negative. Any move up and the MACD will issue a buy signal.
Ultimate Oscillator: The Ultimate Oscillator settings are: Period 1 is 5, Period 2 is 10, Period 3 is 15, Factor 1 is 4, Factor 2 is 2 and Factor 3 is 1. These are not the default settings but are the settings I use with the S&P 500 chart set for 1 to 3 months. The Ultimate Oscillator is back negative after falling lower today.
Rate of Change: Rate Of Change is set for a 21 period. The rate of change signal is negative and moving lower. The reading at the close was negative 8.64 which is getting very oversold and usually is followed by a bounce.
Slow Stochastic: For the Slow Stochastic I use the K period of 14 and D period of 3. The Slow Stochastic tries to predict the market direction further out than just one day. The Slow Stochastic is hold a weak up signal in place.
Fast Stochastic: For the Fast Stochastic I use the K period of 20 and D period of 5. These are not default settings but settings I set for the 1 to 3 month S&P 500 chart when it is set for daily. The Fast Stochastic has a weak sell signal in place.
Market Direction Outlook for Jan 28 2016
Technically the S&P has 5 negative indicators in place but all of them are weak except for the Rate Of Change. The Rate Of Change has a very negative 8.64 reading at the close which is often followed by a rebound rally.
The drop on Wednesday was induced by the Fed comments on interest rates. This is an emotional drop and or fundamental or technical. Normally emotional drops are recovered quickly. As long as oil stays stable or rises, the market should recover on Thursday.
Stay FullyInformed With Email Updates
Market Direction Internal Links
Profiting From Understanding Market Direction (Articles Index)
Understanding Short-Term Signals
Market Direction Portfolio Trades (Members)
Market Direction External Links
IWM ETF Russell 2000 Fund Info
Market Direction SPY ETF 500 Fund Info