
Friday saw stocks try to rally on the back of strong jobs numbers, but the upside lasted just 20 minute and then stocks declined. By the close the SPX had broken through support levels and closed at 1922.03. Friday marked the worst start to a new year in the history of the stock market. If the start of the year is a barometer as to what should be expected, 2016 promises to be volatile and probably “bear” driven. By Friday the indexes were in correction territory.
Advance Decline Numbers
Volume on Friday was average at 4.67 billion shares traded on New York. New 52 week lows came in at 518 and new highs were 20. The NASDAQ saw 359 new lows and just 14 new highs. These numbers show the extent to which sellers have pushed the market into extremely oversold but unless a rally is strong enough to retake the 1965 level, the chance of a sustainable rally is over for now.
Market Indexes Closing Numbers
All indexes closed near their lows. The S&P closed at 1922.03 down 21.06. The Dow Jones closed at 16,346.45 down 167.65. The NASDAQ closed at 4643.63 down 45.80.
Market Direction Technical Indicators At The Close
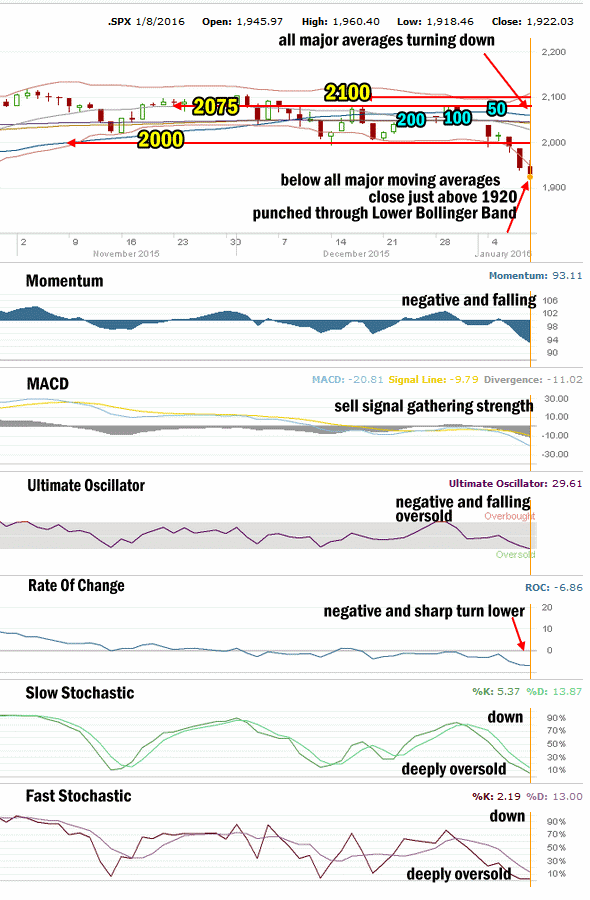
SPX Market Direction Technical Analysis for Jan 8 2016
Stock Chart Comments:
The S&P punched through the Lower Bollinger Band again today helping to turn all the major moving averages lower still. The short-term moving average, the 20 day is falling rapidly. The close for the day saw the S&P just above the 1920 light support level. Next support is 1870 which is strong support and held the market up from the August 24 market panic.
Support and Resistance Levels:
These are the present support and resistance levels. These levels have not changed since January 2015. That is unusual for the stock market and is the first time since I started investing in the early 1970′s that the same support levels have been referred to for what is now more than an entire year.
2100 was light support. Stocks have been unable to stay above this level. It remains resistance.
2075 was light support. Below that is 2050 which was also light support. Stronger support is at 2000 which had repeatedly held the market up throughout each pullback in January and February but failed under the waves of selling in the last correction in August and September and again failed to hold under last week’s selling pressure. Stocks continue to have trouble holding above the 2000 level since the August 2015 correction.
Weak resistance is at 1970 while stronger resistance is at 1956 and technically it is more important than 1970 for the market. 1940 was light support and is now resistance. 1920 is light support but cannot hold determined selling from breaking through. 1900 is more symbolic than anything else.
1870 and 1840 are both levels with strong enough support to delay the market falling and should see a sideways action attempt while investors decide whether to sell or buy. So far 1870 has held the market up better than any of the other support levels aside from 2000 which held the market up for months before the collapse in August 2015.
The other two support levels are 1775 and 1750. I have explained that these two are critical support for the present bull market. While 1775 is important it is 1750 that is the bottom line.
A break of 1750 would mark a severe correction from the all-time high of 2134.72. This would be the biggest correction since 2011 plunge of 271 points for a 20% pullback. A pullback to 1750 from the all-time high would be a drop of 384 points for a decline of 18%. A pull-back of that size would definitely stun investors and bring to question whether the bull market is finished.
Momentum: For momentum I use a 10 period when studying market direction. Momentum on Friday is strongly negative and falling.
MACD Histogram: For MACD Histogram, I am using the Fast Points set at 13, Slow Points at 26 and Smoothing at 9. MACD (Moving Averages Convergence / Divergence) issued a sell signal on Jan 4. That sell signal was very strong on Friday by the close.
Ultimate Oscillator: The Ultimate Oscillator settings are: Period 1 is 5, Period 2 is 10, Period 3 is 15, Factor 1 is 4, Factor 2 is 2 and Factor 3 is 1. These are not the default settings but are the settings I use with the S&P 500 chart set for 1 to 3 months. The Ultimate Oscillator is negative and rapidly falling. It is oversold.
Rate of Change: Rate Of Change is set for a 21 period. The rate of change signal is negative and took a sharp turn lower. At negative 6.86 it is well within range for a rebound rally but it has often been lower in other downturns. Usually below negative 7.50 snap-back rallies are more common.
Slow Stochastic: For the Slow Stochastic I use the K period of 14 and D period of 3. The Slow Stochastic tries to predict the market direction further out than just one day. The Slow Stochastic is signaling lower for stocks and is deeply oversold.
Fast Stochastic: For the Fast Stochastic I use the K period of 20 and D period of 5. These are not default settings but settings I set for the 1 to 3 month S&P 500 chart when it is set for daily. The Fast Stochastic is also pointing lower and is still deeply oversold.
Market Direction Outlook for Jan 11 2016
For Monday stocks could once again try a rally attempt. The problem is any rally needs to get to around 1965 to start pressuring short-sellers to cover their short positions. A move above 1975 would apply the most pressure and could assist to extend a rally toward 2000.
Monday though looks like a rally could still happen but it may end up being very short-lived. For now the momentum and outlook is lower until the 1870 level is reached. I am anticipating that level to be reached Monday or Tuesday and then investors will decide whether to continue to sell-off or find some enough value to risk capital.
Alcoa reports their quarterly results on Monday after the close. It is anticipated that the results are not going to “be pretty”. This will also be pressuring stocks on Monday ahead of earnings, and if worse than expected should continue to pressure stocks for Tuesday.
The outlook remains lower for Monday and negative however with so much pessimism there is always the chance for a rebound attempt once again on Monday.
Stay FullyInformed With Email Updates
Market Direction Internal Links
Profiting From Understanding Market Direction (Articles Index)
Understanding Short-Term Signals
Market Direction Portfolio Trades (Members)
Market Direction External Links
IWM ETF Russell 2000 Fund Info
Market Direction SPY ETF 500 Fund Info