
The outlook last Thursday was for a rally and then more selling. On the weekend when I wrote the Market Direction Outlook or Monday Dec 7 I indicated “Will we see selling return on Monday or Tuesday”.
The strength of the market on Friday though set up the chance for selling on Monday but then a push back by investors. What we saw instead was a knee jerk reaction to the collapse of oil prices and a rising US dollar. All the indexes closed lower but they closed well off the lows of the day. To be able to do that means investors were buying stock from those who were dumping shares and buying it to the point where they were recapturing much of the day’s losses. So now the question is, will the recovery from the lows on Monday by investors, translate into another bottom for stocks and a push higher?
Index Closing Prices
All the indexes closed well above their intraday lows. The S&P closed at 2,077.07 down 14.62 but back at the 2075 support level. The Dow Jones closed at 17,730.51 down 117.51 but well off the day’s low of 17,639.25. The NASDAQ closed at 5101.81 down 40.46 for a drop of 0.79% but still holding most of the gains from Friday.
Advance Decline Numbers
Here is the problem. With 4 billion shares traded 81% of all trades were to the downside and new lows came in at 313. New highs were just 40 and only 19% of stocks move higher. Every day since the end of August following the panic sell-off of August 24, when I review the advance decline numbers the new lows keep swamping new highs. So while the index is moving higher, fewer and fewer stocks are actually participating in this rally which is why every time the index reaches toward 2100 the rally stalls and stocks collapse back.
There is no buying conviction among investors and therein lies the problem. Until that changes the market direction up will continually be sold and sent back down.
This morning I referred to this as a roller coaster ride that investors are trapped on. Until new highs start to swamp new lows, the market has no real staying power to climb and stay higher..
Market Direction Technical Indicators At The Close
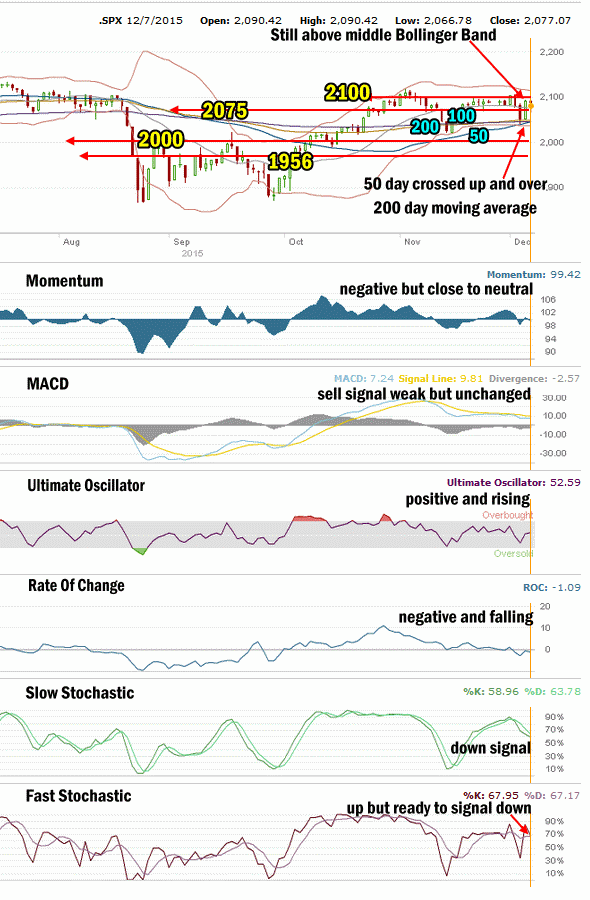
SPX Market Direction Technical Analysis for Dec 7 2015
Stock Chart Comments:
Today’s plunge of stocks on the back of oil’s collapse sent the S&P to 2066.78 which was less than Friday’s low of 2051.24 and Thursday low of 2042.35. The recovery from today’s low left slightly more than half of Friday’s rally still intact. The close left the index right at the Middle Bollinger Band which is a good signal for more moves higher this week. As well the close was still above the important 2075 support level for the market and keeps Friday’s upturn still intact.
One other important event happened today. By the close the 50 day moving average had crossed up and over the 200 day moving average which gave a strong up signal for the market. If the market moves higher or sideways on Tuesday the 50 day may cross the 100 day which will be another strong up signal for stocks.
Support and Resistance Levels:
These are the present support and resistance levels.
2100 was light support. Stocks have been unable to stay above this level and push higher on numerous occasions. It remains resistance.
2075 is light support. Below that is 2050 which is light support. Stronger support is at 2000 which had repeatedly held the market up throughout each pullback in January and February but failed under the waves of selling in the last correction. Stocks continue to have trouble holding the 2000 level.
Weak support is at 1970 while stronger support is at 1956 and technically it is more important than 1970 for the market. 1940 is light support. 1920 is now light support. 1900 is more symbolic than anything else.
1870 and 1840 are both levels with strong enough support to delay the market falling and should see a sideways action attempt while investors decide whether to sell or buy. So far 1870 has held the market up better than any of the other support levels aside from 2000 which held the market up for months before the collapse in August.
The other two support levels are 1775 and 1750. I have explained that these two are critical support for the present bull market. While 1775 is important it is 1750 that is the bottom line.
A break of 1750 would mark a severe correction of 384.72 points or 18% from the all-time high of 2134.72. This would be the biggest correction since April 2012. A pull-back of that size would definitely stun investors and bring to question whether the bull market is finished.
Momentum: For momentum I use a 10 period when studying market direction. Momentum is negative but similar to Friday, it is sitting closer to neutral than negative. .
MACD Histogram: For MACD Histogram, I am using the Fast Points set at 13, Slow Points at 26 and Smoothing at 9. MACD (Moving Averages Convergence / Divergence) issued a sell signal on Friday Nov 10. The sell signal was almost unchanged on Monday from Friday’s reading. Although the sell signal has definitely weakened from back in mid-November, it is still a sell signal.
Ultimate Oscillator: The Ultimate Oscillator settings are: Period 1 is 5, Period 2 is 10, Period 3 is 15, Factor 1 is 4, Factor 2 is 2 and Factor 3 is 1. These are not the default settings but are the settings I use with the S&P 500 chart set for 1 to 3 months. The Ultimate Oscillator is positive and trying to rise.
Rate of Change: Rate Of Change is set for a 21 period. The rate of change signal is negative and moving lower.
Slow Stochastic: For the Slow Stochastic I use the K period of 14 and D period of 3. The Slow Stochastic tries to predict the market direction further out than just one day. The Slow Stochastic is signaling down for stocks which continues the trend from Friday’s down signal.
Fast Stochastic: For the Fast Stochastic I use the K period of 20 and D period of 5. These are not default settings but settings I set for the 1 to 3 month S&P 500 chart when it is set for daily. The Fast Stochastic is signaling up for Tuesday but overall any move lower will generate a sell signal from the Fast Stochastic following today’s negative action.
Market Direction Outlook for Dec 8 2015
The technical indicators are 3 negative, 1 pretty well neutral and 2 positive but just barely. The bias is to the downside then. That does not mean Tuesday may not see a rally or at least a rally attempt. The problem though is the number of new lows is simply too high to be able to support stocks moving higher. Therefore, for Tuesday stocks look set to try to rally perhaps in the morning even if only for a short few minutes to half an hour and then more selling looks probable. If the US dollar pulls back and oil rises, stocks should be able to rally longer on Tuesday but I am not anticipating that will happen.
Stay FullyInformed With Email Updates
Market Direction Internal Links
Profiting From Understanding Market Direction (Articles Index)
Understanding Short-Term Signals
Market Direction Portfolio Trades (Members)
Market Direction External Links
IWM ETF Russell 2000 Fund Info
Market Direction SPY ETF 500 Fund Info