
Yesterday’s big decline left behind a very oversold market so as explained in last night’s notes, a rebound rally should be expected. However yesterday’s pullback is rarely a single day event. In the afternoon oil continued its decline, slipping below $60.00 a barrel. This sent a bit of a shockwave through the markets and volume picked up, but to the downside. The advance that had been strong faltered although there was a slight uptick near the close.
Advance Declines For Dec 11 2014
New lows today came in at 213 while new highs were almost unchanged from yesterday at 101. Volume which had been reasonably good until the afternoon, picked up as stocks began to turn back down. Total volume jumped to 3.9 billion, almost unchanged from Wednesday. The difference was in the volume where 54% of volume was to the upside with 45% to the downside. Up volume had been better earlier in the day but the resumption of the decline of oil in the afternoon dramatically dropped the up volume.
Market Direction Closings For Dec 11 2014
The S&P closed at 2026.14 down 33.68. The Dow closed at 17,533.15 down 268.05. The NASDAQ closed at 4684.03 down 82.44.
Market Direction Technical Indicators At The Close of Dec 11 2014
Let’s review the market direction technical indicators at the close of Dec 11 2014 on the S&P 500 and view the market direction outlook for Dec 12 2014.
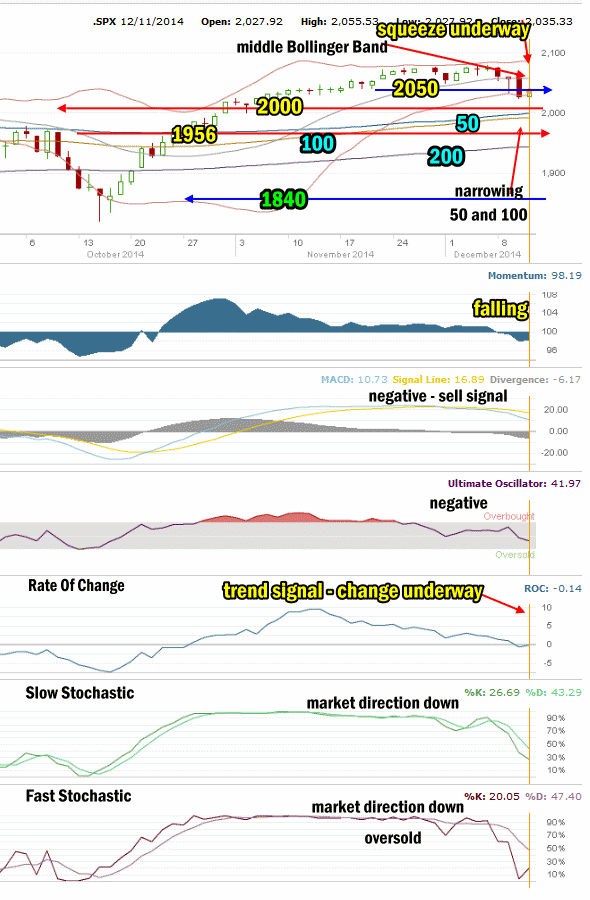
Market Direction Technical Analysis for Dec 11 2014
Stock Chart Comments: The chart today continued to show the SPX trading at the Lower Bollinger Band and below the 20 day simple moving average (SMA). The Bollinger Bands Squeeze continues to now point to lower prices for the SPX as the squeeze is starting to widen and end shortly. The SPX rose above 2050 today and then broke back through it as soon as sellers emerged again. 2000 remains the main support for the market at the present time. The market could fall back to 2000 fairly easily.
There are though some bullish signs to mention. The first is the 50 day continues to trend sideways but has still not fallen below the 100 day exponential moving average (EMA). As well all the action over the past several days continued to be taking place above the 50 day simple moving average (SMA). If stocks can regain their footing, this could end up being a small dip before moving back higher.
2000 is the highest level of decent support at present and while not strong, it should have enough strength to hold sellers back for at least a day in the event of an interim pullback. If 2050 should break, stocks will collapse back to 2000 in very quick order. The next level after 2000 is at 1970 and then 1956.
Strong Support Levels are at 1870 and 1840. Both levels are strong enough to delay the market falling.
The other two support levels not shown in the chart above are 1775 and 1750. I have explained that these two are critical support for the present bull market. While 1775 is important it is 1750 that is now the bottom line.
A break of 1750 would mark a severe correction of more than 13% from the most recent high. This would be the biggest correction since April 2012. A pull-back of that size would definitely stun investors at this point and it is not something I am anticipating at this time.
Momentum: For Momentum I am using the 10 period. Momentum is negative but has not fallen further.
MACD Histogram: For MACD Histogram, I am using the Fast Points set at 13, Slow Points at 26 and Smoothing at 9. MACD (Moving Averages Convergence / Divergence) issued a sell signal on Dec 1. MACD continues negative and is building more strength to the downside.
Ultimate Oscillator: The Ultimate Oscillator settings are: Period 1 is 5, Period 2 is 10, Period 3 is 15, Factor 1 is 4, Factor 2 is 2 and Factor 3 is 1. These are not the default settings but are the settings I use with the S&P 500 chart set for 1 to 3 months. The Ultimate Oscillator stayed negative today.
Rate of Change: Rate Of Change is set for a 21 period. The Rate Of Change is moving lower indicating the trend change is still underway but today it turned sideways. While certainly not much of a signal, it could be advising that the downside action we have seen will end soon. We will need more signals from the Rate Of Change before a firm decision can be made..
Slow Stochastic: For the Slow Stochastic I use the K period of 14 and D period of 3. The Slow Stochastic tries to predict the market direction further out than just one day. The Slow Stochastic is signaling market direction is down.
Fast Stochastic: For the Fast Stochastic I use the K period of 20 and D period of 5. These are not default settings but settings I set for the 1 to 3 month S&P 500 chart when it is set for daily. The Fast Stochastic is signaling a very strong down day tomorrow for stocks. It is oversold and you can see in the chart that it tried to bounce from deeply oversold today..
Market Direction Outlook and Strategy for Dec 12 2014
So where do stocks move from here? Obviously the price of oil mixed with global economic uncertainty is the focus of stocks. It is interesting though that oil has been trending lower for weeks now and the SPX is only now paying attention and even now it is down by only a slight amount from its latest all-time high while oil has plunged. This shows the diversity of the S&P index and in general it is performing as it should. While there is weakness being caused by the oil drop, there is also strength in other stocks, some of which will benefit from the drop in the price of oil. So is this a dip or the start of a major pullback?
It is tough to call which is why my put positions are so much smaller. I am not taking on many new positions as a direct result. The technical indicators in general are bearish but there are glimpses that the downturn might be shallow. The Rate Of Change is turned sideways today often signaling an end to a trend, in the case the end to the downtrend. The Fast Stochastic tried a serous rebound today and momentum actually rose despite being negative. Lastly, history may play a part as well as often the second week of December is poor with pullbacks, dips and sideways trading quite common in the second week of December.
Overall though, the indicators are still pointing lower, so I have to defer to their outlook which is lower still on Friday. Remember though, the SPX is sitting just below all-time highs. The past few days have still not seen the SPX fall to the 50 day SMA which was my original target when I discussed the market direction outlook for this week, last weekend.
So while the SPX is still technically looking at lower valuations there are plenty of signs that a sideways to up turn could be coming shortly. For Friday I won’t be surprised for investors to try a rally again, but the technical indicators are advising stocks will end lower.
Stay FullyInformed With Email Updates
Market Direction Internal Links
Profiting From Understanding Market Direction (Articles Index)
Understanding Short-Term Signals
Market Direction Portfolio Trades (Members)