
It was an interesting day. The market was down early in the day partly due to the sell-off in Europe and China. By the afternoon though cooler heads seemed to prevail and the market closed down only fractionally.
Advance Declines For Dec 9 2014
Volume on Tuesday was almost 4 billion shares. However up volume came in at 57% due to the buying in the afternoon which pushed the market back up. This was far better than yesterday’s up volume. New highs came is at 108 and new lows at 248. What investors want to see tomorrow is the new highs rising and new lows falling away. That will tell us if the market dip is simply a short-term dip before stocks move higher.
Market Direction Closings For Dec 9 2014
The S&P closed at 2059.82 down just 0.49. The Dow closed at 17,801.20 down 51.28 but well off the lows. The NASDAQ closed at 4766.47 up 25.27.
Market Direction Technical Indicators At The Close of Dec 9 2014
Let’s review the market direction technical indicators at the close of Dec 9 2014 on the S&P 500 and view the market direction outlook for Dec 10 2014.
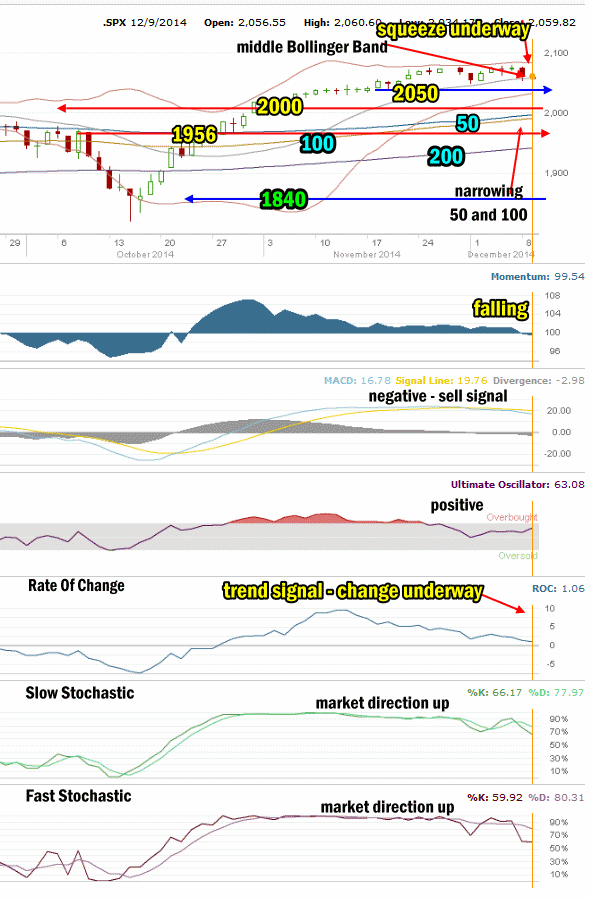
Market Direction Technical Analysis for Dec 09 2014
Stock Chart Comments: The chart today showed that the SPX fell below the 20 day moving average and then pushed back to close back at the 20 day simple moving average (SMA) which is somewhat bullish for stocks. The Bollinger Bands Squeeze continues to take shape and candlesticks still appear ready to break lower although the push back to the 20 day this afternoon bodes well for the market not falling apart here. Remember 2050 is very light support. It will break fairly easy and the market will fall quickly to 2000 once 2050 breaks. The 50 and 100 day moving averages continue to narrow but are still not showing signals the 100 will cross up and over the 50.
The support level at 2050 is light support and will not delay a fall for more than a few hours. 2000 is the highest level of decent support at present and while not strong, it should have enough strength to hold sellers back for at least a day in the event of an interim pullback. If 2050 should break, stocks will collapse back to 2000 in very quick order. The next level after 2000 is at 1970 and then 1956.
Strong Support Levels are at 1870 and 1840. Both levels are strong enough to delay the market falling.
The other two support levels not shown in the chart above are 1775 and 1750. I have explained that these two are critical support for the present bull market. While 1775 is important it is 1750 that is now the bottom line.
A break of 1750 would mark a severe correction of more than 13% from the most recent high. This would be the biggest correction since April 2012. A pull-back of that size would definitely stun investors at this point and it is not something I am anticipating at this time.
Momentum: For Momentum I am using the 10 period. Momentum is negative and falling.
MACD Histogram: For MACD Histogram, I am using the Fast Points set at 13, Slow Points at 26 and Smoothing at 9. MACD (Moving Averages Convergence / Divergence) issued a sell signal on Dec 1. MACD continues negative.
Ultimate Oscillator: The Ultimate Oscillator settings are: Period 1 is 5, Period 2 is 10, Period 3 is 15, Factor 1 is 4, Factor 2 is 2 and Factor 3 is 1. These are not the default settings but are the settings I use with the S&P 500 chart set for 1 to 3 months. The Ultimate Oscillator remained positive today and climbed indicating buying pressure in the dip.
Rate of Change: Rate Of Change is set for a 21 period. The Rate Of Change is moving lower indicating the trend change is now underway.
Slow Stochastic: For the Slow Stochastic I use the K period of 14 and D period of 3. The Slow Stochastic tries to predict the market direction further out than just one day. The Slow Stochastic is signaling market direction is up but has not issued a buy signal.
Fast Stochastic: For the Fast Stochastic I use the K period of 20 and D period of 5. These are not default settings but settings I set for the 1 to 3 month S&P 500 chart when it is set for daily. The Fast Stochastic is signaling up for stocks, and it too has not yet issued a buy signal.
Market Direction Outlook and Strategy for Dec 10 2014
Investors need to see the number of new lows drop off to sustain any kind of rally higher. As well the 50 day moving average needs to move higher and away from the 100 day moving average. Both of these indicators need to be watched on Wednesday.
I explained yesterday that these types of drops or dips are needed to build support levels for stocks to move higher. What we want to see now is stocks not fall back to 2050 but hang in at levels above or at 2050. The drop this morning fell to below 2050 at 2034.17 but then investors stepped in and pushed the market back above 2050 to 2059.82. We will have to see if 2050 starts to provide stronger support for a higher move later this week. Right now stocks are still weak.
The most important event today was the recovery in the afternoon and the higher level of buying today. The other important event was the positive close of the NASDAQ. With both stochastic indicators pointing up and the Ultimate Oscillator continuing to climb signaling buying pressure, the outlook for Wednesday is for stocks to turn back up. While there will be some weakness perhaps in the morning or after the lunch hour, we should see a positive close on Wednesday for stocks.
Stay FullyInformed With Email Updates
Market Direction Internal Links
Profiting From Understanding Market Direction (Articles Index)
Understanding Short-Term Signals
Market Direction Portfolio Trades (Members)