FullyInformed.com

Market Direction Outlook For Aug 14 2015 – Continued Weakness

Aug 13, 2015 | Stock Market Outlook

The give back of Thursday’s rally was unfortunate for the bulls but was not the first time this has happened this year. Lately the markets have given back many of the rallies started so today was just another example of a failed rally.  The Weekly Initial Unemployment Insurance Claims numbers on Thursday were better than expected which once again seemed to surprise investors and analysts alike. If the rest of the globe is so slow, why is America continuing to create so many jobs? None of the analysts I listened to on Thursday had reasonable explanations for the continued strength in the jobs numbers. That started the day off negative.

Advance Decline Numbers for Aug 13 2015

Volume fell back to 3.2 billion shares traded with 62% of all volume to the downside. New lows came in at 122 while new highs were just 61. In general market breadth has been poor which often are signs of a stronger pullback yet to come. Whether we see such a pullback is anyone’s guess at the moment..

Market Direction Technical Indicators At The Close of Aug 13 2015

Let’s review the market direction technical indicators at the close of Aug 13 2015 on the S&P 500 and view the market direction outlook for Aug 14 2015.

Market Direction Technical Analysis for Aug 13 2015

Market Direction Technical Analysis for Aug 13 2015

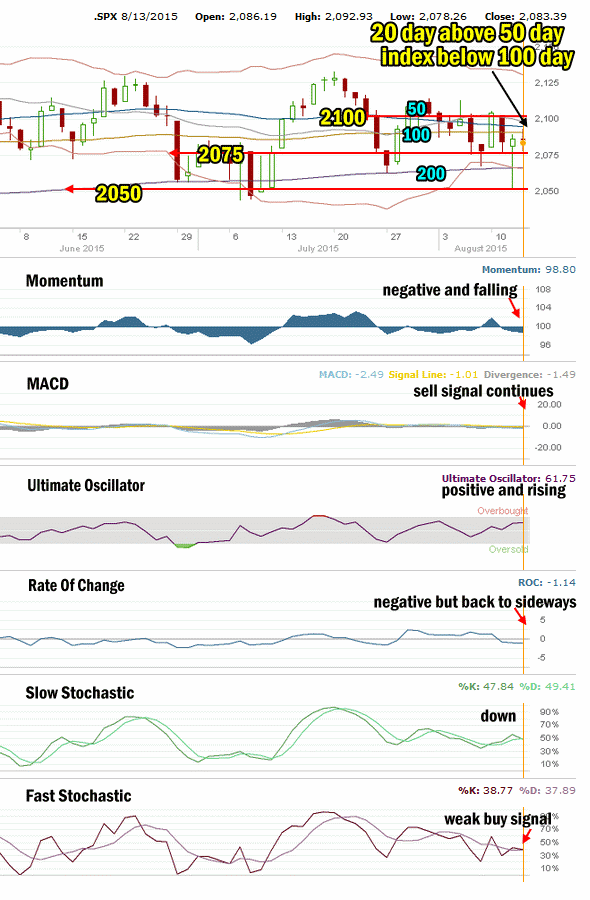
Stock Chart Comments:

Looking at the chart you can clearly see that the S&P is making a pattern of lower highs. The lower lows pattern is not showing up yet but with stocks now trending sideways the bias is moving back to the downside. The 20 day is falling lower and the 50 day continues to slide toward the 100 day. The SPX meanwhile is trending below the 100 day moving average.

Support and Resistance Levels:

These are the present support and resistance levels and there are still no changes.

2100 is light support. Stocks will have to stay above it to change it back to solid support and convince investors that the market has staying power and will push well beyond 2100. That still does not appear to be the case.

2075 is light support. Below that is 2050 which is also light support. Stronger support is at 2000 which has repeatedly held the market up throughout each pullback in January and February.

Weak support is at 1970. Stronger support is at 1956.

1870 and 1840 are both levels with strong enough support to delay the market falling and should see a sideways action attempt while investors decide whether to sell or buy.

The other two support levels are 1775 and 1750. I have explained that these two are critical support for the present bull market. While 1775 is important it is 1750 that is the bottom line.

A break of 1750 would mark a severe correction from the most recent high. This would be the biggest correction since April 2012. A pull-back of that size would definitely stun investors and bring to question whether the bull market is finished.

Momentum: Momentum is negative and falling.

MACD Histogram: For MACD Histogram, I am using the Fast Points set at 13, Slow Points at 26 and Smoothing at 9. MACD (Moving Averages Convergence / Divergence) issued a sell signal on August 4 that was still growing to the downside on Thursday..

Ultimate Oscillator: The Ultimate Oscillator settings are: Period 1 is 5, Period 2 is 10, Period 3 is 15, Factor 1 is 4, Factor 2 is 2 and Factor 3 is 1. These are not the default settings but are the settings I use with the S&P 500 chart set for 1 to 3 months. The Ultimate Oscillator is rising and nearing overbought.

Rate of Change: Rate Of Change is set for a 21 period. The rate of change signal remains negative and is pointing lower for stocks.

Slow Stochastic: For the Slow Stochastic I use the K period of 14 and D period of 3. The Slow Stochastic tries to predict the market direction further out than just one day. The Slow Stochastic is signaling down for stocks.

Fast Stochastic: For the Fast Stochastic I use the K period of 20 and D period of 5. These are not default settings but settings I set for the 1 to 3 month S&P 500 chart when it is set for daily. The Fast Stochastic has a weak buy signal in place but the readings are very weak.

Market Direction Outlook for August 14 2015

The give back of the rally today could set the market up for another attempt on Friday. This is something that has occurred often this year, however the technical indicators in general are weak to the upside but are growing stronger to the downside. Friday looks like a down day as weakness continues with stocks.

Stay FullyInformed With Email Updates

    Your First Name (required)

    Your Email (required)

    Anti-Spam: Please Answer This Math Question

    I will send you a reply to confirm that you want to subscribe before sending any emails.


    Market Direction Internal Links

    Profiting From Understanding Market Direction (Articles Index)

    How I Use Market Timing

    How I Use Market Timing

    Understanding Short-Term Signals

    Various Market Timing Systems

    Market Direction Portfolio Trades (Members)

    Market Direction External Links

    Market Direction

    IWM ETF Russell 2000 Fund Info

    Market Direction SPY ETF 500 Fund Info

    Search

    Select to view all results...

    Generic selectors
    Exact matches only
    Search in title
    Search in content
    Post Type Selectors

    Recent Outlooks

    Stock Market Outlook for Fri Apr 26 2024 – Higher and Positive Close

    Prior Trading Day Summary: Thursday’s GDP number came in much lower than expected at 1.6%. This stunned analysts and investors and the market plunged at the start of the day. However buyers took advantage of the plunge and snapped up …

    Morning Investing Strategy Notes for Thu Apr 25 2024

    For FullyInformed Members the morning Investing Strategy Notes for Thu Apr 25 2024 discuss the expected sell-off and weakness after the recent bounce in equities. There are a large number of trades outlined for today. These include Tesla Stock (TSLA), …

    Stock Market Outlook for Thu Apr 25 2024 – Weakness and Lower

    Prior Trading Day Summary: Wednesday saw the rally stall. With the rally stalling investors took profits which weighed on stocks. The close saw the SPX up just 1 point at 5071 and the NASDAQ higher by 16 points to 15,712 …

    Morning Investing Strategy Notes for Wed Apr 24 2024

    For FullyInformed Members the morning Investing Strategy Notes for Wed Apr 24 2024 discuss the second bounce on Tuesday and the outlook for the remainder of the week. There are a large number of trades outlined for today. These include …

    Stock Market Outlook for Wed Apr 24 2024 – Some Weakness But Higher Close

    Prior Trading Day Summary: Tuesday saw the rally continue for a second day with rising up volume, wider market breadth and a higher gain. All of this is bullish. Much of the credit came from the PMI numbers which were …

    Morning Investing Strategy Notes for Tue Apr 23 2024

    For FullyInformed Members the morning Investing Strategy Notes for Tue Apr 23 2024 discuss the bounce on Monday. There are trade ideas on a wide number of stocks including Nucor Stock (NUE), General Electric Stock (GE), United Parcel Service Stock …

    Stock Market Outlook for Tue Apr 23 2024 – Bounce But Lower

    Prior Trading Day Summary: Monday saw the long awaited bounce from the recent selling and market breadth was bullish. The SPX rose 43 points recovering all of Friday’s loss to close back above 5000 at 5010. The NASDAQ jumped 169 …

    Morning Investing Strategy Notes for Mon Apr 22 2024

    For FullyInformed Members the morning Investing Strategy Notes for Mon Apr 22 2024 discuss the outlook for the start of the fourth week of April. There are also comments on repairing positions using AMD and ARM as examples. There are …

    Stock Market Outlook for Mon Apr 22 2024 – No Change – Deeply Oversold Bounce Possible

    Prior Trading Day Summary: Friday saw stocks open flat and try to climb within the first 15 minutes. When that failed the selling continued. The early afternoon saw a rally attempt once the SPX fell below 5000 but the bounce …

    Morning Investing Strategy Notes for Fri Apr 19 2024

    For FullyInformed Members the morning Investing Strategy Notes for Fri Apr 19 2024 discuss the outlook for for a potential bounce that ends the day with the indexes positive. There are comments and trade ideas on Netflix Stock (NFLX), American …

    Stock Market Outlook for Fri Apr 19 2024 – Deeply Oversold – Bounce Likely – Higher Close

    Prior Trading Day Summary: Thursday saw another morning bounce attempt but no follow through. However the SPX did not break below 5000 and managed to close at 5011 although minutes before the close it was 5020 which would have turned …

    Morning Investing Strategy Notes for Thu Apr 18 2024

    For FullyInformed Members the morning Investing Strategy Notes for Thu Apr 18 2024 discuss the outlook for Thursday and a possible bounce or a move lower. There are trade ideas outlined in Netflix Stock (NFLX), American Express Company Stock (AXP) …

    Stock Market Outlook for Thu Apr 18 2024 – Deeply Oversold – Bounce Attempt Expected

    Prior Trading Day Summary: Wednesday saw a bounce attempt at the open which managed to reach 5078 before selling once again pushed stocks lower. By 12:45 stocks looks almost ready to break below 5000 but managed to find buyers who …

    Morning Investing Strategy Notes for Wed Apr 17 2024

    For FullyInformed Members the morning Investing Strategy Notes for Wed Apr 17 2024 discuss the outlook for a potential bounce on Wednesday. There are trade ideas outlined in Las Vegas Sands Stock (LVS), Alcoa Stock (AA), Discover Financial Stock (DFS) …