
The market direction outlook for Monday Apr 27 2015 was for stocks to face weakness but keep an up bias. Previously I explained that at present there is no support for stocks above 2100. Even at 2100 the support is very light. This means stocks as they become overbought are going to face stiffer resistance as sellers will continue to unload positions including many that have small gains.
Advance Decline for Apr 27 2015
All three indexes pulled back today but losses were small on all three indexes. Volume was almost unchanged from Friday with 3.4 billion shares traded. Of those trades 59% were moving lower while 40% were to the upside. New highs were almost unchanged from Friday at 90 and new lows were virtually unchanged at just 13.
Advance decline numbers at present is continuing to point to simple weakness from an overbought condition and not much else.
Market Direction Closings For Apr 27 2015
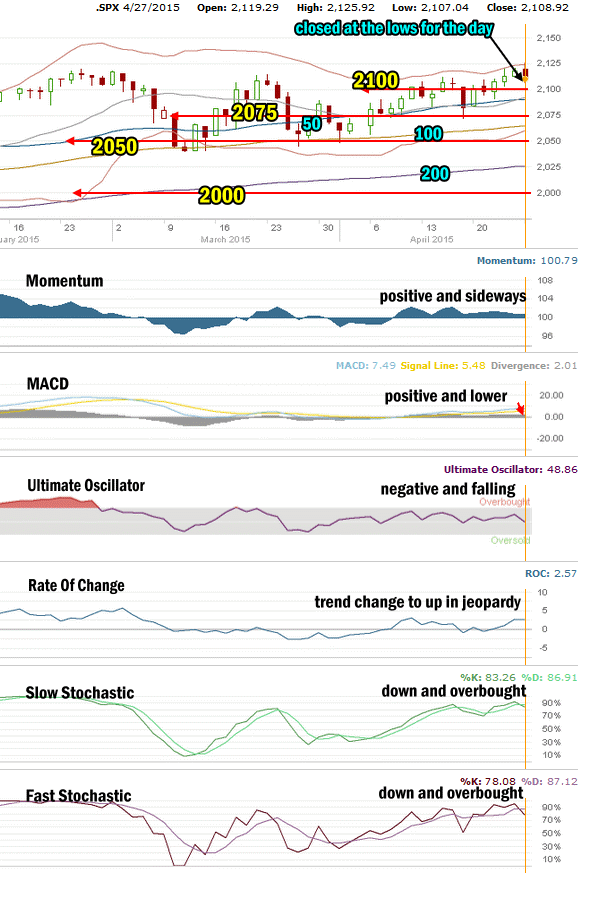
The S&P closed at 2,108.92 down 8.77. The Dow closed at 18,037.97 down 42.17. The NASDAQ closed at 5060.25 down 31.84.
Market Direction Technical Indicators At The Close of Apr 27 2015
Let’s review the market direction technical indicators at the close of Apr 27 2015 on the S&P 500 and view the market direction outlook for Apr 28 2015.
Market Direction Technical Analysis for Apr 27 2015
Stock Chart Comments:
My outlook for Monday was for stocks to be under pressure in the morning but still keep an up bias and close positive. Instead stocks were under pressure all day and closed right near the lows for the day.
The new highs in the S&P and NASDAQ continue to bring out sellers who take every spike higher as an opportunity to sell out of trades.
The 20 day simple moving average (SMA) is now above the 50 day simple moving average (SMA) but whether it can continue to build to the upside is tough to predict at present.
The pullback today from the Upper Bollinger Band is not encouraging for those who believe stocks can move a lot higher from here. Instead stocks are facing constant selling pressure any time they move to new highs or come even close to new highs. This is not the kind of action that builds momentum or strength for further moves up. Instead it is the kind of action that warns that stocks may fall back to gain support before trying to push higher again.
Support and Resistance Levels:
These are the present support and resistance levels.
2100 was very light support. Stocks will have to stay above it to change it back to solid support and convince investors that the market has staying power and will push well beyond 2100. That still does not appear to be the case.
2075 is light support. Below that is 2050 which is also light support. Stronger support is at 2000 which has repeatedly held the market up throughout each pullback in January and February.
Weak support is at 1970. Stronger support is at 1956.
1870 and 1840 are both levels with strong enough support to delay the market falling and should see a sideways action attempt while investors decide whether to sell or buy.
The other two support levels are 1775 and 1750. I have explained that these two are critical support for the present bull market. While 1775 is important it is 1750 that is the bottom line.
A break of 1750 would mark a severe correction from the most recent high. This would be the biggest correction since April 2012. A pull-back of that size would definitely stun investors and bring to question whether the bull market is finished.
Momentum: For Momentum I am using the 10 period. Momentum is positive but now moving sideways.
MACD Histogram: For MACD Histogram, I am using the Fast Points set at 13, Slow Points at 26 and Smoothing at 9. MACD (Moving Averages Convergence / Divergence) issued a buy signal on Apr 9 and that signal moved lower on Monday.
Ultimate Oscillator: The Ultimate Oscillator settings are: Period 1 is 5, Period 2 is 10, Period 3 is 15, Factor 1 is 4, Factor 2 is 2 and Factor 3 is 1. These are not the default settings but are the settings I use with the S&P 500 chart set for 1 to 3 months. The Ultimate Oscillator is negative and falling.
Rate of Change: Rate Of Change is set for a 21 period. The rate of change which just started to signal up for stocks turned sharply sideways today. While definitely not a signal down, it does indicate that the up signal may be in jeopardy of failing before it even confirms the recent up signal.
Slow Stochastic: For the Slow Stochastic I use the K period of 14 and D period of 3. The Slow Stochastic tries to predict the market direction further out than just one day. The slow stochastic is pointing down for stocks and is overbought.
Fast Stochastic: For the Fast Stochastic I use the K period of 20 and D period of 5. These are not default settings but settings I set for the 1 to 3 month S&P 500 chart when it is set for daily. The Fast Stochastic is pointing down for stocks and it too is overbought.
Market Direction Outlook for Apr 28 2015
While Monday’s losses were small, they were somewhat disappointing. Weakness was expected, but it was not anticipated to dominate the day. Stocks closed at the lows for the day. Often this starts the following day with a bounce before more selling emerges. Momentum is key for trading on Tuesday. It needs to stay positive.
Presently the indicators are mixed. Three are pointing lower for stocks. One is undecided (Rate Of Change) and two are still positive but pulling back and weakening.
There are two difference scenarios emerging. The first is that tomorrow investors will see heavier selling, part of which was caused by the strong pullback from April 17.
The second scenario is that stocks moved lower today to consolidate recent gains before pushing higher. Stocks on Tuesday may fall back below 2100 but if they close below it on Tuesday, I would expect more selling to turn up for Wednesday. Tuesday then is critical for the present rally. Stocks need to hold the 2100 level.
My personal outlook is for stocks to bounce at the open, sell lower and then recover in the afternoon. If that fails to happen, then more selling lies ahead.
Stay FullyInformed With Email Updates
Market Direction Internal Links
Profiting From Understanding Market Direction (Articles Index)
Understanding Short-Term Signals
Market Direction Portfolio Trades (Members)