
FullyInformed.com
Generic filters
Exact matches only
Search in title
Search in content
Search in excerpt

Market Direction Outlook For Feb 7 2013 – Roller Coaster Ending

Feb 6, 2013 | Stock Market Outlook

Market Direction today turned back to sideways as the market wandered and tried to close near its highs but at least it did close in positive territory even though only by a slim margin. Part of the lackluster day for market direction was caused by the lack of economic news today. Interestingly the US Dollar was higher today as was Gold which is not too often a common combination. The market continues showing signs of strength but the sideways action won’t last much longer. The roller coaster move of the past 3 days has set the market up for either a move higher or a retrenchment. Let’s check the market direction technical indicators to see which way the market direction appears poised to move on Feb 7.

Market Direction Closings

The S&P 500 closed at 1512.12, up 0.83 points and the Dow closed at 13,986.52, up 7.22 points. The NASDAQ closed at 3168.48 down 3.10.

Market Direction Technical Indicators At The Close of Feb 06 2013

Let’s take a moment now and review the market direction technical indicators at the close of today on the S&P 500 and view tomorrow’s outlook.
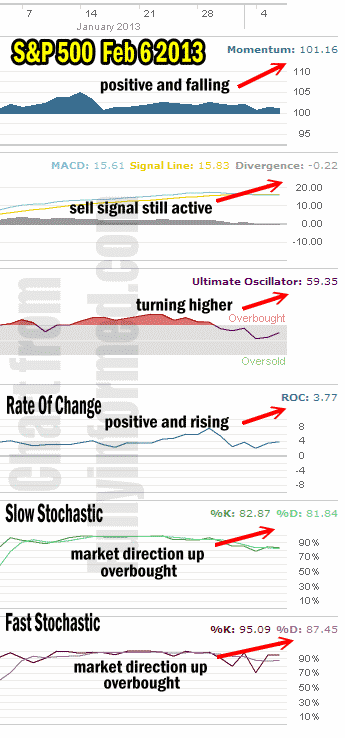
Market Direction technical indicators for Feb 6 2013

Market Direction technical indicators for Feb 6 2013

For Momentum I am using the 10 period. Momentum is still positive but it is sliding lower.

For MACD Histogram I am using the Fast Points set at 13, Slow Points at 26 and Smoothing at 9. MACD (Moving Averages Convergence / Divergence) is still moving lower which confirmed the market direction down call from two days earlier.

The Ultimate Oscillator settings are Period 1 is 5, Period 2 is 10, Period 3 is 15, Factor 1 is 4, Factor 2 is 2 and Factor 3 is 1. These are not the default settings but are the settings I use with the S&P 500 chart set for 1 to 3 months.

The Ultimate Oscillator is still positive and is back climbing, a good sign for market direction to continue higher.

Rate Of Change is set for a 21 period. Rate Of Change is still positive and is moving higher.

For the Slow Stochastic I use the K period of 14 and D period of 3. The Slow Stochastic is overbought but signaling that market direction will be higher in two or three days out.

For the Fast Stochastic I use the K period of 20 and D period of 5. These are not default settings but settings I set for the 1 to 3 month S&P 500 chart when it is set for daily. The Fast Stochastic is also overbought and it is indicating tomorrow will be higher.

Market Direction Outlook And Strategy for Feb 07 2013

The market direction outlook for the next trading day is for an attempt to push the market direction higher. The Fast Stochastic is the most visible sign of a push higher as it has a wide-spread between its K and D period readings. We could therefore see a sharply higher day. Meanwhile MACD is still indicating that a sell signal is still active which is part of the reason I prefer to remain with a cautious stance on the markets when it comes to my investing.

Internal Market Direction Links

Profiting From Understanding Market Direction (Articles Index)

Market Timing Articles Index

How I Use Market Timing

Understanding Short-Term Signals

Various Market Timing Systems

Market Direction Candlestick Daily View (Members only)

Market Direction Portfolio Ongoing Trades (Members only)

Recent Outlooks

Stock Market Outlook For Thu Jul 9 2026 – Weakness Returns

Prior Trading Day Summary On Wed Jul 8 2026 investors were once again focused on rising oil prices, inflation worries and the Iran conflict. The latest FOMC minutes were also a concern as they seemed to point to a strong …

Morning Investing Strategy Notes for Wed Jul 8 2026

For FullyInformed Members the morning Investing Strategy Notes for Wed Jul 8 2026 discuss the latest confirmed up signal versus the weakness we are seeing once again in many stocks. Equities discussed today include FedEx Stock (FDX), Citigroup Stock (C), …

Stock Market Outlook For Wed Jul 8 2026 – MACD Up Signal Confirmed

Prior Trading Day Summary On Tue Jul 7 2026 investors returned their focus to rising oil prices as tension rose in the Iran ceasefire. This combined with continuing worries about AI expense and chip stocks outlook, saw investors selling stocks …

Morning Investing Strategy Notes for Tue Jul 7 2026

For FullyInformed Members the morning Investing Strategy Notes for Tue Jul 7 2026 discuss the latest up signal and setting up some trades on Tuesday to try to take advantage of any move higher in stocks. Equities discussed today include …

Stock Market Outlook For Tue Jul 7 2026 – Still Bullish – Higher

Prior Trading Day Summary On Mon Jul 6 2026 stocks started the day with a bounce and built momentum on light volume of 5.1 billion. The SPX closed up 54 points to 7537. 51% of trading volume was rising along …

Morning Investing Strategy Notes for Mon Jul 6 2026

For FullyInformed Members the morning Investing Strategy Notes for Mon Jul 6 2026 discuss the outlook for the week following the long July 4th weekend. Equities discussed today include IWM ETF, Apple Stock (AAPL), FedEx Stock (FDX) and more. The …

Stock Market Outlook For Mon Jul 6 2026 – Choppy Dips Likely But Higher

Prior Trading Day Summary On Thu Jul 2 2026 the June Non-Farm Payroll Numbers came out much weaker than expected. Stocks initially shot higher but then spent most of the day giving back the early gains. By the close the …

Morning Investing Strategy Notes for Thu Jul 2 2026

For FullyInformed Members the morning Investing Strategy Notes for Thu Jul 2 2026 discusses the upcoming June Non-Farm Payroll Numbers due out today at 8:30. Equities discussed today include Apple Stock (AAPL), Nike Stock (NKE), Microsoft Stock (MSFT) and more …

Stock Market Outlook For Thu Jul 2 2026 – All About June Jobs Numbers

Prior Trading Day Summary On Wed Jul 1 2026 stocks experienced some weakness as many investors wait for the June Non-Farm Payroll Numbers due out today at 8:30. The SPX lost 16 points to close at 7483 on 5.9 billion …

Morning Investing Strategy Notes for Wed Jul 1 2026

For FullyInformed Members the morning Investing Strategy Notes for Wed Jul 1 2026 review the second day of the rally. Equities discussed today include Nike Stock (NKE), FedEx Stock (FDX) and more. The morning Investing Strategy Notes are for FullyInformed …

Stock Market Outlook For Wed Jul 1 2026 – Dips Likely But Still Bullish

Prior Trading Day Summary On Tue Jun 30 2026 the indexes continued their advances. The SPX closed up 59 points to 7499 on 6.2 billion shares traded. 45% of all stocks were rising by the close. The past two days have …

Morning Investing Strategy Notes for Tue Jun 30 2026

For FullyInformed Members the morning Investing Strategy Notes for Tue Jun 30 2026 review the bounce on Monday and its potential to move higher. Equities discussed today include Eli Lilly Stock (LLY), Nucor Stock (NUE), Microsoft Stock (MSFT), Nike Stock …

Stock Market Outlook For Tue Jun 30 2026 – Choppy With Dips But Still Higher

Prior Trading Day Summary On Mon Jun 29 2026 stocks rebounded with the Dow Jones Index setting another new record high. The SPX closed up 86 points to 7440 on 5.9 billion shares traded. 54% of all stocks were rising …

Morning Investing Strategy Notes for Mon Jun 29 2026

For FullyInformed Members the morning Investing Strategy Notes for Mon Jun 29 2026 review Friday’s trading action and the outlook for the present shortened week. Equities discussed today include Alphabet Stock (GOOGL), Qualcomm Stock (QCOM), Microsoft Stock (MSFT), IWM ETF …

Subscribe For The Latest News