
FullyInformed.com
Generic filters
Exact matches only
Search in title
Search in content
Search in excerpt

Market Direction Outlook for Dec 4 2012 – Jitters

Dec 3, 2012 | Stock Market Outlook

Market Direction on Monday saw a very nice jump-start and from there is was all down hill. Market direction turned bearish within a few minutes of the open and failed to recover, closing on the lows of the day. This is definitely a bearish signal. There were a lot of reasons including of course the fiscal cliff mess. GM reported weak sales and a huge rise in inventory. Ford though reported a 6.5 percent rise of sales in November but its stock fell almost half a percent. Meanwhile Dell stock rose on analysts recommendations out of Goldman which moved to buy from sell on the stock. The brightest news for the day came first thing in the morning with news that China saw its manufacturing index at the highest level in seven months. That bit of news got the market direction up at the open, but that was it.

Europe continues to perform well, particularly Germany’s stock market which is up 25% for the year. The move by Greece to buy back their own bonds at distressed prices makes a lot of sense and I couldn’t figure out why they didn’t do it earlier. Rather than dumping in hundreds of billions to try to rescue Greece why wasn’t the ECB and IMF buying up the Greek debt that was at fire sale prices earlier in this debacle? Wouldn’t that have been money well spent. Someone finally clued in to what investors have known for decades. You buy when others won’t and for Greek debt it is obviously the time to buy.

Overall the S&P was down 6.72 or half a percent as was the Dow. The NASDAQ was down just a bit more than a quarter of a point but still closed above the psychological important 3000 level.

Let’s look at the market timing technical indicators for today.

Market Timing Technical Indicators For Market Direction

For Momentum I am using the 10 period. Momentum is up but today’s pullback has momentum starting to slow. The market has had too many see-saw type days and it is impacting momentum.

For MACD Histogram I am using the Fast Points set at 13, Slow Points at 26 and Smoothing at 9. MACD (Moving Averages Convergence / Divergence) is still positive but has pulled back a bit from friday.

The Ultimate Oscillator settings are Period 1 is 5, Period 2 is 10, Period 3 is 15, Factor 1 is 4, Factor 2 is 2 and Factor 3 is 1. These are not the default settings but are the settings I use with the S&P 500 chart set for 1 to 3 months.

The Ultimate Oscillator is no longer overbought and is turning down.

Rate Of Change is set for a 10 period. Rate Of Change is still positive.

For the Slow Stochastic I use the K period of 14 and D period of 3. The Slow Stochastic is extremely overbought but the readings have turned more neutral than bearish or bullish.

For the Fast Stochastic I use the K period of 20 and D period of 5. These are not default settings but settings I set for the 1 to 3 month S&P 500 chart when it is set for daily. The Fast Stochastic is somewhat overbought and it too is neutral in its market direction outlook.
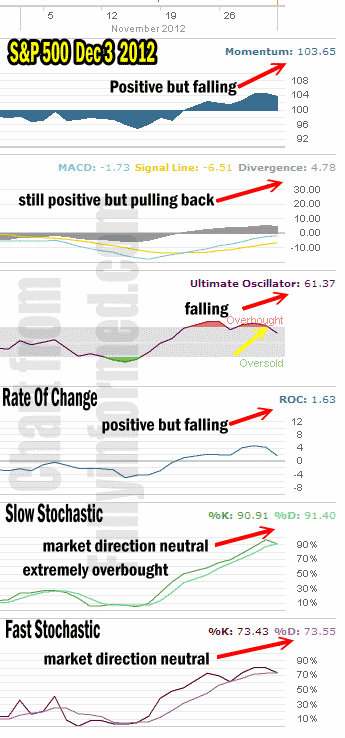
Market Direction outlook Dec 3 2012


The consensus among the technical indicators is that weakness is growing. The market direction after the close on Friday showed that the rally was tiring and beginning to fizzle out. The general consensus now is that the market direction is changing to back down or at the least sideways. Until the fiscal cliff can be resolved it will be hard for the markets to rise much higher.

Market Direction Outlook And Strategy

The change for market direction is for a return to a down trend. It could still be quite choppy but the general underlying current in the market direction is that moving higher is facing too much resistance and with the fiscal cliff on the minds of investors, the easier route is to move lower.

Market Direction then for Tuesday is a neutral outlook with a bias to the downside as the stock market direction faces heavier resistance. I had felt there was a good chance the S&P could reach the 50 period moving average before pulling back, but right now the markets look too weak to push much higher.

Those who follow candlestick chart analysis will have noticed that the close today was a black candlestick which confirmed the Friday signal of a possible downturn in the market direction. The candlestick chart analysis issued a sell signal at the close today.

We could see more market direction action on Tuesday like today. I will be doing the Trading For Pennies Strategy tomorrow. I did not have a chance today to trade it.

Internal Market Direction Links

Market Timing Articles Index

How I Use Market Timing

Understanding Short-Term Signals

Various Market Timing Systems

Recent Outlooks

Stock Market Outlook For Thu Jul 9 2026 – Weakness Returns

Prior Trading Day Summary On Wed Jul 8 2026 investors were once again focused on rising oil prices, inflation worries and the Iran conflict. The latest FOMC minutes were also a concern as they seemed to point to a strong …

Morning Investing Strategy Notes for Wed Jul 8 2026

For FullyInformed Members the morning Investing Strategy Notes for Wed Jul 8 2026 discuss the latest confirmed up signal versus the weakness we are seeing once again in many stocks. Equities discussed today include FedEx Stock (FDX), Citigroup Stock (C), …

Stock Market Outlook For Wed Jul 8 2026 – MACD Up Signal Confirmed

Prior Trading Day Summary On Tue Jul 7 2026 investors returned their focus to rising oil prices as tension rose in the Iran ceasefire. This combined with continuing worries about AI expense and chip stocks outlook, saw investors selling stocks …

Morning Investing Strategy Notes for Tue Jul 7 2026

For FullyInformed Members the morning Investing Strategy Notes for Tue Jul 7 2026 discuss the latest up signal and setting up some trades on Tuesday to try to take advantage of any move higher in stocks. Equities discussed today include …

Stock Market Outlook For Tue Jul 7 2026 – Still Bullish – Higher

Prior Trading Day Summary On Mon Jul 6 2026 stocks started the day with a bounce and built momentum on light volume of 5.1 billion. The SPX closed up 54 points to 7537. 51% of trading volume was rising along …

Morning Investing Strategy Notes for Mon Jul 6 2026

For FullyInformed Members the morning Investing Strategy Notes for Mon Jul 6 2026 discuss the outlook for the week following the long July 4th weekend. Equities discussed today include IWM ETF, Apple Stock (AAPL), FedEx Stock (FDX) and more. The …

Stock Market Outlook For Mon Jul 6 2026 – Choppy Dips Likely But Higher

Prior Trading Day Summary On Thu Jul 2 2026 the June Non-Farm Payroll Numbers came out much weaker than expected. Stocks initially shot higher but then spent most of the day giving back the early gains. By the close the …

Morning Investing Strategy Notes for Thu Jul 2 2026

For FullyInformed Members the morning Investing Strategy Notes for Thu Jul 2 2026 discusses the upcoming June Non-Farm Payroll Numbers due out today at 8:30. Equities discussed today include Apple Stock (AAPL), Nike Stock (NKE), Microsoft Stock (MSFT) and more …

Stock Market Outlook For Thu Jul 2 2026 – All About June Jobs Numbers

Prior Trading Day Summary On Wed Jul 1 2026 stocks experienced some weakness as many investors wait for the June Non-Farm Payroll Numbers due out today at 8:30. The SPX lost 16 points to close at 7483 on 5.9 billion …

Morning Investing Strategy Notes for Wed Jul 1 2026

For FullyInformed Members the morning Investing Strategy Notes for Wed Jul 1 2026 review the second day of the rally. Equities discussed today include Nike Stock (NKE), FedEx Stock (FDX) and more. The morning Investing Strategy Notes are for FullyInformed …

Stock Market Outlook For Wed Jul 1 2026 – Dips Likely But Still Bullish

Prior Trading Day Summary On Tue Jun 30 2026 the indexes continued their advances. The SPX closed up 59 points to 7499 on 6.2 billion shares traded. 45% of all stocks were rising by the close. The past two days have …

Morning Investing Strategy Notes for Tue Jun 30 2026

For FullyInformed Members the morning Investing Strategy Notes for Tue Jun 30 2026 review the bounce on Monday and its potential to move higher. Equities discussed today include Eli Lilly Stock (LLY), Nucor Stock (NUE), Microsoft Stock (MSFT), Nike Stock …

Stock Market Outlook For Tue Jun 30 2026 – Choppy With Dips But Still Higher

Prior Trading Day Summary On Mon Jun 29 2026 stocks rebounded with the Dow Jones Index setting another new record high. The SPX closed up 86 points to 7440 on 5.9 billion shares traded. 54% of all stocks were rising …

Morning Investing Strategy Notes for Mon Jun 29 2026

For FullyInformed Members the morning Investing Strategy Notes for Mon Jun 29 2026 review Friday’s trading action and the outlook for the present shortened week. Equities discussed today include Alphabet Stock (GOOGL), Qualcomm Stock (QCOM), Microsoft Stock (MSFT), IWM ETF …

Subscribe For The Latest News