
The market direction outlook for Monday was for some weakness. I was not expecting a large drop but at one point the Dow broke 16000 as it pushed down just below 15987. Recalling the articles I wrote discussing the problem with large round numbers for the indexes, today showed what a bit of weakness can do. The indexes can drop quickly. There were a number of reasons for today’s selling including the ISM numbers that showed stronger manufacturing than expected. This caused a lot of investors to worry that the unemployment report on Friday will be better than expected, causing the Fed to begin tapering in December. I still don’t think the Fed will scale back in December, but that’s just a guess.
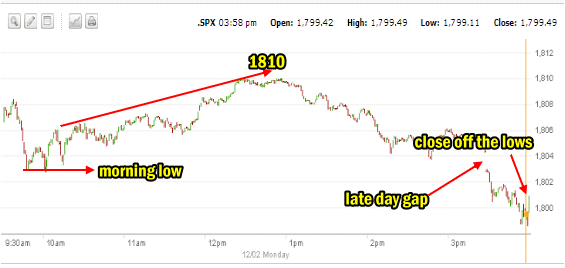
Market Direction S&P 500 Intraday For Dec 2 2013
The one minute chart below shows today’s action. The morning saw an early low with three attempts to push lower. When the market direction did not move lower, investors stepped in and bought enough stocks to push the S&P 500 back up to try to challenge 1810. Unfortunately as explained in last night’s market direction outlook, the direction did not have enough conviction from investors to push higher. With year-end window dressing coming to a close, stocks will see more volatile days in December.
The rally lasted until just after the lunch hour. Without being able to push through 1810, investors decided to take profits. There was a late day gap around 1804 which I expect will be tested on Tuesday. Meanwhile the S&P managed to close just off the lows but did break the 1800 barrier just as the Dow broke 16000. This will either be seen as a test for support by investors, or as a break of support. We will know more in a day or two.
IWM ETF Direction
I commented about the IWM ETF during my intraday comments today. Let’s take a look at the close. The IWM closed just off the 10 period exponential moving average (EMA) after touching it late in the day. The Middle Bollinger Band is still down around the $110.50 to $111.00 area so the IWM has lots of room it can fall before turning very negative.
Selling volume today was slightly above average. Momentum is positive but declining. The Slow Stochastic however issued a sell signal at the close today. Last is MACD which is still positive and has supported the rally higher over the past week and a half.
We will have to see what the IWM ETF looks like at the close tomorrow before predicting what is next for the small cap stocks.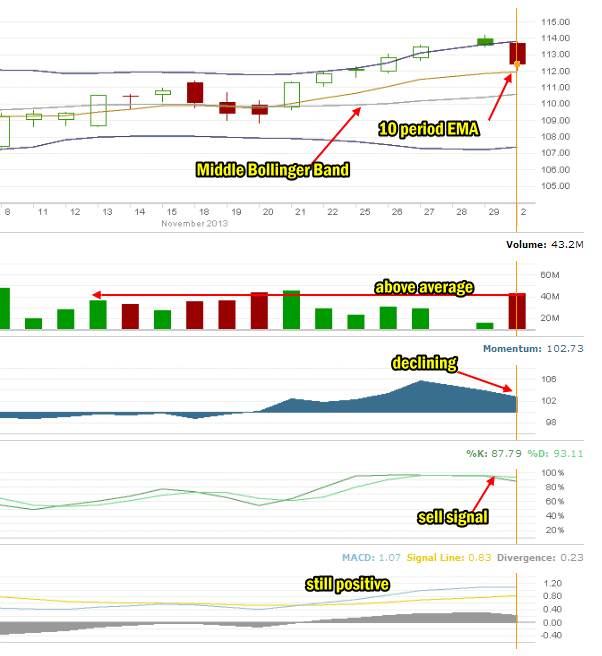
Advance Declines For Dec 2 2013
While the morning rally may have looked impressive the advance – decline ratio tells us quite a different story. Declining issues outpaced advancing issues by a wide margin with 70% declining versus 27% advancing. The new highs were at 160 but the new lows are creeping up with 119 new lows today.
Market Direction Closing For Dec 2 2013
The S&P 500 closed at 1,800.90 down 4.91. The Dow closed at 16,008.77 down 77.64. The NASDAQ closed at 4045.25 down 14.63.
The IWM ETF closed at $112.37 down 1 percent on the day.
Market Direction Technical Indicators At The Close of Dec 2 2013
Let’s review the market direction technical indicators at the close of Dec 2 2013 on the S&P 500 and view the market direction outlook for Dec 3 2013.
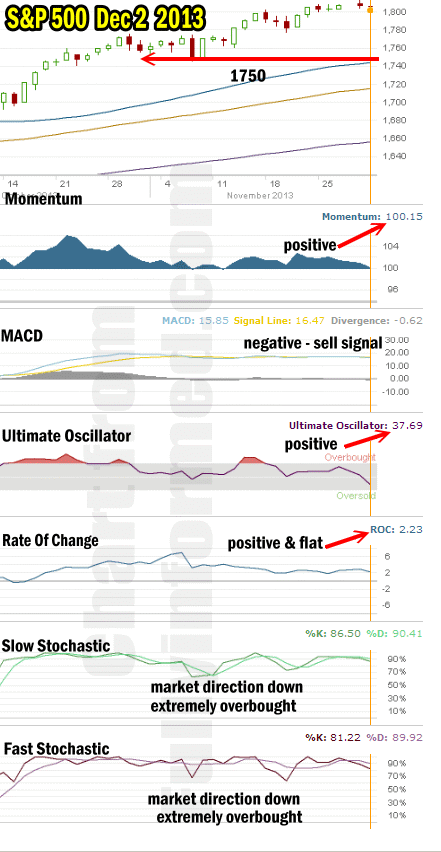
The most important support line in the S&P 500 at this time in the ongoing rally remains 1750. That support line is holding the market direction up at present and that has not changed. As explained before, many analysts see 1775 as support but there really is very little support at that level. Instead 1750 offers this rally the best support and if 1750 should break than the trend will definitely change to down.
For Momentum I am using the 10 period. Momentum is still positive but just barely with a reading of 100.15. One more day down and momentum will be negative.
For MACD Histogram I am using the Fast Points set at 13, Slow Points at 26 and Smoothing at 9. MACD (Moving Averages Convergence / Divergence) issued a weak buy signal on Nov 22 and that buy signal was given a very weak confirmation on Nov 25. On Friday Nov 29 MACD was slightly negative. Today though it gave a stronger negative reading with negative 0.62 signaling that the confirmed trend is lower.
The Ultimate Oscillator settings are Period 1 is 5, Period 2 is 10, Period 3 is 15, Factor 1 is 4, Factor 2 is 2 and Factor 3 is 1. These are not the default settings but are the settings I use with the S&P 500 chart set for 1 to 3 months.
The Ultimate Oscillator took a big drop today and is now strongly negative.
Rate Of Change is set for a 21 period. The Rate Of Change is positive but down slightly showing again a lack of conviction among buyers.
For the Slow Stochastic I use the K period of 14 and D period of 3. The Slow Stochastic is signaling that the market direction is down. It is extremely overbought.
For the Fast Stochastic I use the K period of 20 and D period of 5. These are not default settings but settings I set for the 1 to 3 month S&P 500 chart when it is set for daily. The Fast Stochastic is signaling that the market direction is down and it is also extremely overbought.
Market Direction Outlook And Strategy for Dec 3 2013
The market direction technical indicators are almost all indicating that stocks will be moving lower on Tuesday. I do think there is a chance for the S&P to try to fill the late day gap from today around the 1804 valuation but if it does it the signals all point to the market direction still moving lower.
Whether this is a change in trend or just repositioning for the unemployment report on Friday, is difficult to say at this point. We need another day to see how strong the selling may be. Once we get through Tuesday we will have a better idea.
For now it is wait and see for Tuesday. There are a few trades opening up but I don’t see much point in Put Selling tomorrow in the morning until I see how much selling could enter the market. The S&P is well supported at 1750 and for now the market direction is exhibiting more the “round numbers” problem that it exhibited in the past, many times. I see no cause for concern at this stage but if heavier selling should enter the market tomorrow that should assist in getting volatility higher and pushing option premiums up. I will be looking for Put Selling opportunities should that occur.
For tomorrow then the we could see a short-lived bounce but then the market direction will end up being lower.
For FullyInformed Members, the market direction portfolio was stopped out today just slightly below my stop-loss. You can review today’s trades through this link. The market direction portfolio is now up 37.3% for the year.
Market Direction Internal Links
Profiting From Understanding Market Direction (Articles Index)
Understanding Short-Term Signals
Market Direction Portfolio Trades (Members)
Market Direction External Links
Market Direction IWM ETF Russell 2000 Fund Info
Market Direction SPY ETF 500 Fund Info