
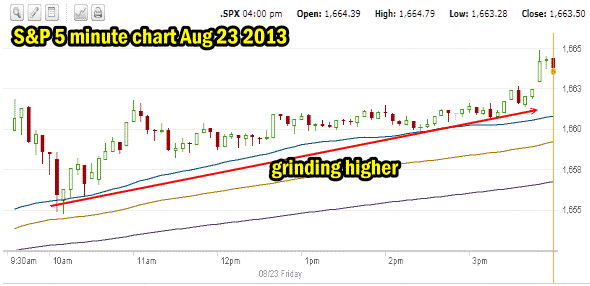
The outlook for Friday was for the market direction to continue up as it continued Thursday’s rally. The morning saw the market sell-off by 10 AM and then it spent the rest of the day grinding slowly back and finally in the last 15 minutes the S&P 500 pushed to close higher than the previous close and back above the 50 day simple moving average (SMA) .
The move back up to close above the 50 day simple moving average (SMA) is important as it signaled a higher day for Monday but also set us a bench mark for the upcoming week. The market direction must now hold above the 50 day simple moving average (SMA) or risk investors selling off positions further if the market direction should turn and move back below the 50 day simple moving average (SMA).
Market Direction Closing For Aug 23 2013
The S&P 500 closed at 1,663.50 up 6.54. The Dow closed at 15,010.51 up 46.77 and back above 15000. The NASDAQ closed at 3,657.79 up 19.09 and still above other 50 day simple moving average (SMA) after never having dropped below it during this past correction.
Market Direction Technical Indicators At The Close of Aug 23 2013
Let’s review the market direction technical indicators at the close of Aug 23 2013 on the S&P 500 and view the market direction outlook for Aug 26 2013.
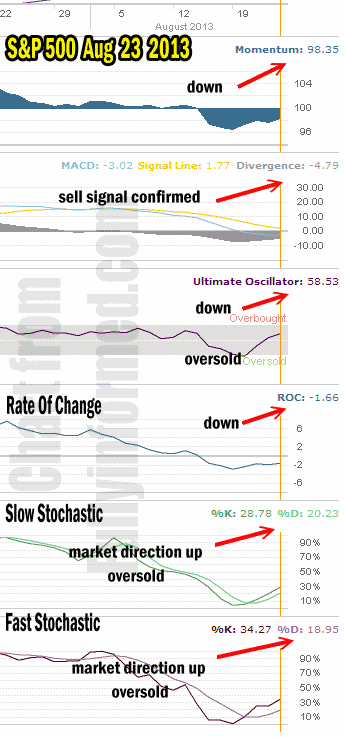
For Momentum I am using the 10 period. Momentum is still negative but it is once more higher than it was on Thursday as it continues to climb back from the selling pressure of earlier in the week.
For MACD Histogram I am using the Fast Points set at 13, Slow Points at 26 and Smoothing at 9. MACD (Moving Averages Convergence / Divergence) issued a weak sell signal on July 31 which was confirmed August 7. MACD moved higher again today which could be another signal that the market direction may rally again on Monday but at negative 4.79 it is still a strong sell signal.
The Ultimate Oscillator settings are Period 1 is 5, Period 2 is 10, Period 3 is 15, Factor 1 is 4, Factor 2 is 2 and Factor 3 is 1. These are not the default settings but are the settings I use with the S&P 500 chart set for 1 to 3 months.
The Ultimate Oscillator is has turned back up and is now positive having regained from the selling earlier in the week. It continues to point to higher prices on Monday.
Rate Of Change is set for a 21 period. The rate of change is negative but once more is moving back up.
For the Slow Stochastic I use the K period of 14 and D period of 3. The Slow Stochastic is signaling that the market direction is up and while still oversold, the up signal is strong. As the Slow Stochastic looks out more than a day or two, the up signal means we should see some higher prices by mid-week.
For the Fast Stochastic I use the K period of 20 and D period of 5. These are not default settings but settings I set for the 1 to 3 month S&P 500 chart when it is set for daily. The Fast Stochastic is indicating that the market direction is up for tomorrow. It too is oversold.
Market Direction Outlook And Strategy for Aug 26 2013
While the market direction technical indicators remain for the most part negative there are lots of signs that the market direction will continue higher on Monday. One of the interesting charts for the past several weeks has been the Russell 2000 ETF, which trades under the symbol IWM. This ETF represents 2000 of the small to mid-size publicly traded companies. it is often a good ETF to glance at daily as it represents a stronger undercurrent on stocks than does the S&P 500.
Russell 2000 IWM Market Direction
The Russell 2000 is well worth watching. Since the fall of 2012 the Russell 2000 has continued to exhibit the bullish pattern of lower highs (red arrow) and higher highs (blue arrow). Even the recent selling which pushed the IWM ETF lower, failed to set a lower low, but instead is exhibiting all the signs of a shallow correction that is about to end.
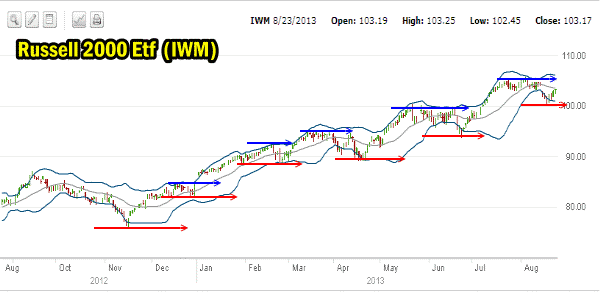
The strongest signal right now for the S&P 500 is whether it can continue to stay above the 50 day simple moving average (SMA). That is the signal I am presently watching. The Russell 2000 (IWM) is important as it often warns in advance, when the market direction is entering a larger correction. At present there are no signals from IWM that this will be the case.
I am continuing to look for Put Selling opportunities as well as a handful of stock trading opportunities as they develop. When they do I will be pouncing on them. For Monday then I believe the market direction will pushing higher than Friday’s close.
Market Direction Internal Links
Profiting From Understanding Market Direction (Articles Index)
Understanding Short-Term Signals
Market Direction Portfolio Trades (Members)
Market Direction External Links
Market Direction IWM ETF Russell 2000 Fund Info
Market Direction SPY ETF 500 Fund Info