
The rally I had expected for Friday or early next week started on Thursday. The extreme oversold condition of the market pushed back as traders bought into this opportunity for a quick trade. As well economic data out of China and Europe show that manufacturing is continuing to make gains. Last is the effect of the Fed finally indicating that the scaling back of Quantitative Easing is a reality and will begin this fall. Investors hate uncertainty and with the Fed question out-of-the-way for the most part, a very oversold market direction and some better than expected manufacturing numbers brought investors back to trade.
Market Direction Back Above 1650
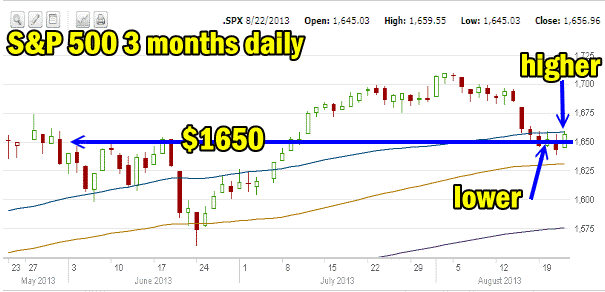
The key element for this latest rally is the 1650 level on the S&P 500. This level is important support which stretches back to June before Fed Chairman Bernanke spooked investors with his announcement of a scaling back of Quantitative Easing as early as September. The S&P 500 is still below the 50 day moving average which you can see as the blue line in the chart below but it is back above 1650. This marks the highest close in three days and a higher close than the Tuesday’s up day. The fact that the market direction closed almost on the highs for the day is also a good sign that this rally may last more than a day or two.
NASDAQ Market Direction Still Above the 50 Day
Despite the NASDAQ closure for 3 hours which effectively cost millions of dollars in revenue, the NASDAQ has been the one index to signal that this latest pull back would be shallow in nature. How accurate longer term it will be is tough to judge but at this point the NASDAQ may be right and the market direction may be about ready to rally back for a few days at least.
Market Direction Closing For Aug 22 2013
The S&P 500 closed at 1,656.96 up 14.16. The Dow closed at 14,963.74 up 66.19. The NASDAQ closed at 3,638.71 up 38.92.
Market Direction Technical Indicators At The Close of Aug 22 2013
Let’s review the market direction technical indicators at the close of Aug 22 2013 on the S&P 500 and view the market direction outlook for Aug 23 2013.
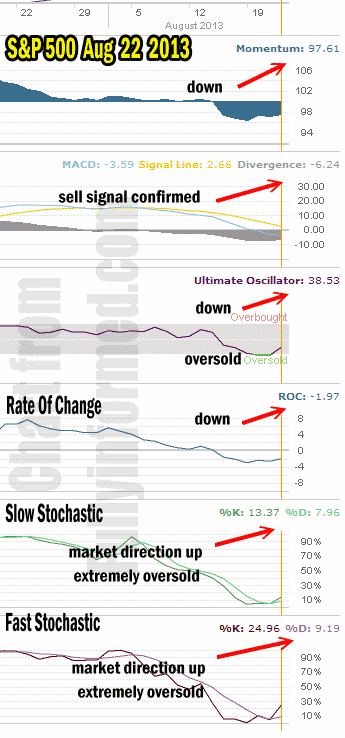
For Momentum I am using the 10 period. Momentum is strongly negative but continues to climb higher from previous lows indicating that the selling pressure is easing.
For MACD Histogram I am using the Fast Points set at 13, Slow Points at 26 and Smoothing at 9. MACD (Moving Averages Convergence / Divergence) issued a weak sell signal on July 31 which was confirmed August 7. MACD moved higher today which could be another signal that the market direction may rally again tomorrow.
The Ultimate Oscillator settings are Period 1 is 5, Period 2 is 10, Period 3 is 15, Factor 1 is 4, Factor 2 is 2 and Factor 3 is 1. These are not the default settings but are the settings I use with the S&P 500 chart set for 1 to 3 months.
The Ultimate Oscillator is strongly negative and has reached extremely oversold levels. As I indicated yesterday normally such an oversold state results in a snap back rally. The Ultimate Oscillator is moving higher today which normally signals another up day on Friday.
Rate Of Change is set for a 21 period. The rate of change is negative but moving back up.
For the Slow Stochastic I use the K period of 14 and D period of 3. The Slow Stochastic is signaling that the market direction is up and while still oversold, the up signal is strong. As the Slow Stochastic looks out more than a day or two, the up signal means we should see some higher prices early next week as well.
For the Fast Stochastic I use the K period of 20 and D period of 5. These are not default settings but settings I set for the 1 to 3 month S&P 500 chart when it is set for daily. The Fast Stochastic is indicating that the market direction is up strongly for tomorrow. It too is extremely oversold.
Market Direction Outlook And Strategy for Aug 23 2013
All the technical indicators are still negative and a number remain extremely oversold but there are many signals that would indicate that once again tomorrow the market direction is up. The Fast Stochastic in particular is pointing to a higher day tomorrow. In my market direction comments yesterday I indicated that a rally could start by Friday or early next week. I believe this rally could last longer than a couple of days.
I will continue to be Put Selling but I will also be making changes to the market direction portfolio and I would advise on two other areas:
1) ABX Stock which I sell options against could still see higher prices. I plan to be on the Put Selling side but will continue to hold off on naked calls.
2) My VIX Index Oct $13 call options are all sold as of yesterday and I will be buying more shortly as I do believe the VIX Index will pull back below $13.00 in this next rally.
3) I will be making adjustments to the market direction portfolio for FullyInformed Members.
4) Investors who are using the Trading For Pennies strategy should now change to having a bias to the upside.
While many stocks did not pull back far in the latest downturn, I do believe there was enough movement lower that investors will jump on many stocks and drive them back up. I will be looking for more Put Selling opportunities tomorrow but I will not be holding many of them into expiry but instead will be buying back sold puts in this next rally. The market looks strong enough to rally for a few days but I do believe technically it will be hard to set new highs and I will be looking to add to my Spy Put Options in the next pull back. For Friday then I believe the market will rally further. The key remains the 1650 level. Any close back below means the rally is not going to hold and the market direction will shift back to down.
Market Direction Internal Links
Profiting From Understanding Market Direction (Articles Index)
Understanding Short-Term Signals
Market Direction Portfolio Trades (Members)
Market Direction External Links
Market Direction IWM ETF Russell 2000 Fund Info
Market Direction SPY ETF 500 Fund Info