
Market direction is often difficult to predict. For one thing, stock markets are moody to say the least. They’re like a bad date. One minute the date is going well, the wine is out, love is in the air and the next someone’s spilled something, its raining out and well ahem, it will be an early evening if you get my drift. That’s what the stock markets are like as well. Everything just seemed to be going along so well only a few trading sessions ago and now we are in a tail-spin.
While market direction may seem terribly unpredictable, often it actually isn’t. For example my spy put trade on April 10 was simple and straight forward. The market opened down, drifted sideways, refused to rally and because of this, I bought spy puts and held them to the close. Since I had written earlier about how my market timing technical indicators were looking for a bounce and there wasn’t one, then obviously there was only one way the market direction could take, down. So I bought spy puts and sold them at the close.
Tuesday evening the market timing technicals were so badly oversold that the fast stochastic practically screamed that a bounce was about to happen and on Wednesday, it did. Sometimes, it’s not as hard to predict market direction as it seems.
Market Timing / Market Direction for April 11 2012
Before going into the technicals for the day, let’s take a look at the S&P chart for the past 3 months. The most telling aspect of the present S&P 500 stock chart is the break of the 50 day on Tuesday on BIG volume. Then today the market tried BUT it failed to recover the 50 day. Unless the market recovers the 50 day moving average quickly, market direction will definitely fall lower.
Another aspect is the widening gap between where the market presently is and the highs it must recover to confirm the bull market is still alive and kicking. You can see that if the bull market is going to stay alive it has a lot of heavy work ahead. It must push beyond 1425 up to $1435 just to confirm “bull activity”. I don’t see that happening without more capital being put into the market and presently I don’t think most investors, particularly institutional are willing to risk capital.
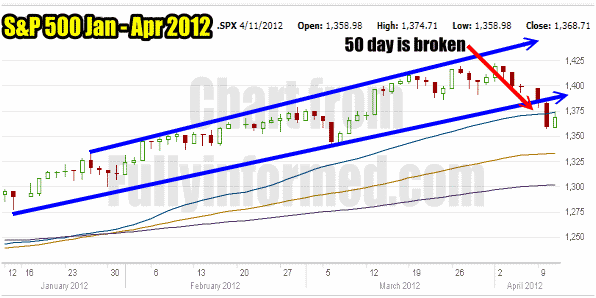
S&P 500 Stock Chart from Jan to April 2012 shows the market direction confirmed lower.
NASDAQ CHART FOR APR 11 2012
I am going to throw in the NASDAQ chart for today to show a problem emerging. Tuesday’s heavy selling saw the 50 day moving average act as support. Today the NASDAQ recovered a bit and bounce off the 50 day. However both the NASDAQ and the S&P 500 did not close on the highs for the day today. This would appear then to be a bounce from an oversold condition and not much more. Looking at the blue arrow, look how high the NASDAQ must move to confirm the bull market is still with investors. This is 200 points higher!
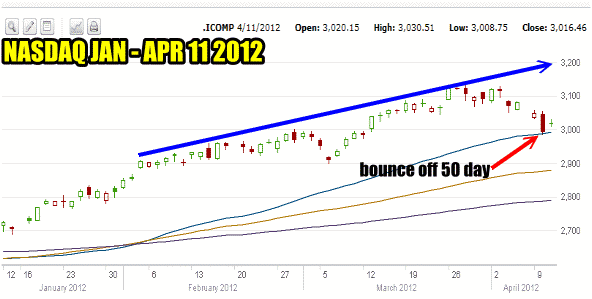
The NASDAQ Chart for Apr 11 2012 Shows The 50 Day Is About To Break
Market Timing / Market Direction Technical Indicators
My market timing technical indicators are not actually overjoyed with today’s rally. This tells me that today was a bounce. There could be some follow through but overall MACD Moving Average Convergence / Divergence, is telling me that the market will move lower still. Since the market has broken the 50 day moving average I believe MACD is correct.
Here is a quick look at each market timing technical indicator as far as market direction is concerned.
Momentum turned up but it is still negative so there is lots of room for the market to move lower. MACD as explained is considerably lower than yesterday and reflects that while there was a lot of buying today, most of it was trading and not a lot of long-term positions were put in place today. MACD does not confirm today’s rally which as readers may recall is a classic sign from my early warning tools to spot a collapsing stock article that this market will move lower.
The Ultimate Oscillator has turned sideways at best today which could at least tell us that the market direction may be sideways for a day or two. Slow stochastic has moved even lower than yesterday again confirming what MACD is telling us. Fast Stochastic shows today’s bounce.
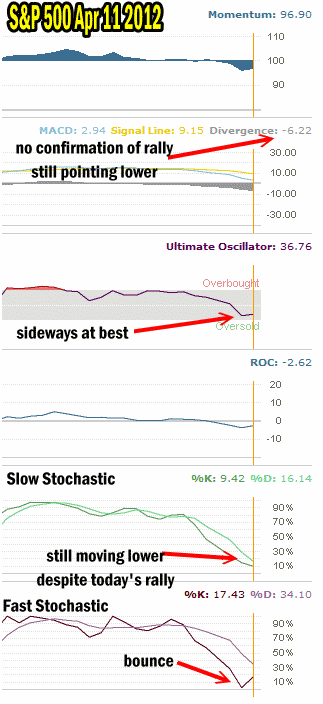
Market timing technical indicators are pointing to market direction moving still lower.
What To Do If Selling Puts
The market timing technical indicators show that this market wants to move lower. It may not happen overnight, but in order for it to move higher there must be renewed buying and investors must be willing to risk their capital. I read that many analysts are now calling the S&P 500 as under-valued and many stocks as oversold.
There is a BIG difference between under-valued and oversold. These are not the same thing. Even over-valued stocks become oversold. Yet analysts put both of these terms into the same sentence which is incorrect. Personally I feel that many stocks are still overvalued despite the recent selling. This instinct therefore tells me that the market will move lower.
If put selling, be careful and refuse to sell puts on any rise in stocks only on declines and out of the money. Instead look to buy back sold puts in every rally so as to be able to sell them again in the next pull back. If the market should move higher from here, watch to see if it can break beyond 1422 before committing capital to holding stocks. If day trading buy only on the dips and personally I would be taking profits on any rise.
For some of my stocks I am unconcerned as I am holding covered calls on my stocks and will earn the dividend and wait for recovery. I will continue with my spy put hedge and I will be selling puts when stocks selloff lower again. Having a plan is important in any market environment but remaining cautious is imperative. Perhaps it is opportune for me to dust off the cautious bull strategy once again until market direction can be confirmed as solidly back up.