Market direction today keeps being one day behind my market timing indicators. On Friday my market timing indicators showed market direction up for Monday. Instead the market sold off. On Monday my market timing indicators showed a bias to the downside for Tuesday. Instead the market direction was up on Tuesday. On Tuesday my market timing indicators were for market up on Wednesday. Instead on Wednesday the market direction was down. On Wednesday my market timing indicators were for market direction down for Thursday. Today though the market direction moved up. Every day I have been one day early, or is it one day late with my stock market direction outlook.
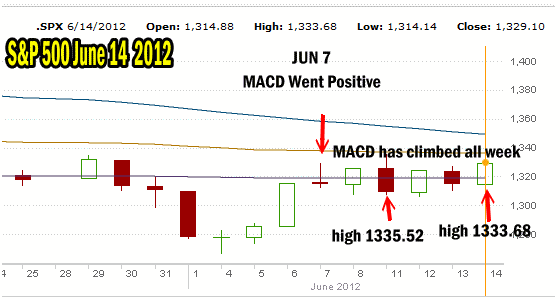
Market Direction Chart for June 14 2012
Today’s stock market direction chart shows that by and large the S&P has not gone anywhere over the past 5 trading sessions, but today the S&P 500 managed to close at the high for the day. Today’s close of 1329.68 was just below the high of 1333.68 which was near Monday’s high of 1335.52. The stock market direction has been sideways and it is obvious that as I indicated yesterday, investors are unwilling to sell much below these levels but they do not want to buy much above this level either until they find out which way Greece is going to vote this weekend.

While market direction has been whipsawed all week, the MACD Histogram has been climbing signalling market direction is up.
The Bernanke Market Direction Put
Since 2009 for better or worse, the Federal Reserve has been dumping in hundreds of billions of dollars into various program trying to stimulate the US economy into job growth which should also put a floor under housing prices. Select this market direction link to read the Fed’s own report on the maturity extension program. A fancy title meaning quantitative easing. This easing has inflated stock prices.
If the US economy grows then the global community should also grow. Despite what analysts are busy telling people, China’s economy pales in comparison to the US economy in everything from numbers to diversity. So let’s be straight about this, China can boom, but if the US economy tanks, the rest of the world will follow the US. On the other hand if the European community should decide to end the Euro, then global growth will slow and anyone who thinks this will not affect the US is not thinking clearly. Stock market direction will tank if the Euro ends as the world sorts out the ramifications of the end of the Euro.
Meanwhile, against this backdrop we have investors in stocks, bonds and commodities waiting to see if the Federal Reserve is going to stimulate some more which will push stock market direction higher and increase commodity prices.
Personally I think if Greece should leave the Euro, the Fed at that time will go into high gear. But if this weekend Greece votes to support pro-Euro parties, then I imagine the Fed will do minor tweaking until they see stronger evidence of a more pronounced slowdown in the US economy.
But investors don’t care about debt, wars or economic calamity. They care about profits, the stock market direction and with the Fed supporting stocks through quantitative easing, investors don’t worry about what next month or the next quarter might bring. They only know that as long as there is money pouring in, stocks will rise and they will make more money. Most believe they can get out before this party ends and it will end badly at some point. I wrote an article called Dance Near The Exit which looks at that assumption by investors. How many can get out when the Bernanke Market Put is finally pulled away is anyone’s guess. However right now most investors are betting that the Fed will act and pump in more money.
Market Timing Technical Indicators Predicting Market Direction
Due to this belief among investors, market timing technical indicators have had trouble predicting market direction. Overall they are correct in the underlying theme of support at this level, which is why if the 1300 level broke on good volume, there would be a lot of concern among investors. Nonetheless, my market timing indicators are advising caution at this stage until we get through this weekend.
Market Timing MACD Histogram
One market timing indicator, the MACD Histogram has called this week perfectly and continues to become more bullish. On June 7 MACD gave a short-term market direction up signal. And despite all the whipsawing this week, it has not wavered in that call. Every day it has climbed and today it has reached 4.26 which is becoming downright bullish again. Now you know why so many investors use the MACD Histogram when following market direction. The MACD Histogram signaled a major downturn on April 4. This latest signal is presently a short-term market up call and not an indication that market direction has changed. But despite all the whipsawing, any investor who followed the MACD Histogram since June 7 has been fine albeit not actually profitable, but fine nonetheless.
Market Timing Indicators Outlook
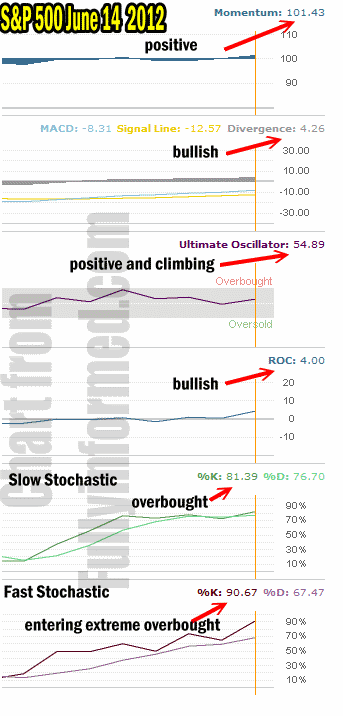
Recalling that June options expiry Friday has had market direction down 7 of the last 13 years with an average loss of half a percent, my market timing indicators are indicating that market direction should be up on Friday. All the indicators are in good shape although two are now into overbought territory and indeed the fast stochastic is reaching extreme overbought, but a lot of that will have been caused by Thursday afternoon’s big run up on the news about the G20 central banks prepared to act in the event of a problem this weekend should Greece vote for a non-austerity measures political party. Personally I believe Greece may come up with no clear winner yet again, but who knows.
Momentum is back positive and this time it is at 101.43 showing a bit more conviction among investors.
MACD Histogram as explained, is positive and getting pretty bullish with a reading of 4.26.
The Ultimate Oscillator is back to positive with a reading of 54.89
Rate of change is very positive with a reading of 4.00
Slow stochastic is now in overbought territory but has a strong bullish bias.
Fast stochastic is reaching extreme overbought with a reading of %K 90.67 and %D 67.47. This is a big divergence and a signal that the market can pop from here. Remember though that a lot of this 90.67 reading was caused by the big jump in the afternoon and this could change overnight.

Today's market timing indicators are all positive. Two indicators are moving deep into overbought readings. Market Direction is up according to the market timing technicals.
Where Is Market Direction Heading?
Market direction based on all the above market timing technical indicators is now fully leaning to up. Not one indicator is down. Even the overbought readings does not mean the market will pull back. Markets can stay overbought for a few days without any problem of pulling back. It would still appear that the 1300 level is holding well and while the S&P 500 has not gone anywhere since Monday’s high, at least we are back to Monday’s high which is helping to firm up the stock market direction.
For candlestick technical analysis, the candlestick pattern at market close was a long white candlestick bullish engulfing which means if we have an up day tomorrow the market direction signal will be up.
