Johnson and Johnson stock is one of those companies that a lot of investors dream about tucking away for the ever-increasing dividend. Johnson and Johnson stock symbol is JNJ and it trades on New York. Indeed Johnson and Johnson stock is excellent for dividend retirement portfolios. In 2002 the quarterly dividend was .205 cents. In 2006 it was .33 cents and today it is .57 cents and Johnson and Johnson has just announced another dividend increase. From 2002 to 2012, the dividend has gone up 178 percent. This is the type of return an investor in dividends is looking for. While Johnson and Johnson stock has not seen a steady increase in value, this doesn’t concern a lot of investors who are looking for the dividend and not the stock valuation. Many investors put this type of stock away for decades.
Other investors want to own the stock indefinitely, collect the dividend but they want to juice the dividend a little bit more by selling covered calls. I would agree with this strategy. Why earn 3.6% a year (today’s dividend valuation) when you can possibly earn 7% or better, every year. But to accomplish this with covered calls you need to establish a strategy that encompasses selling covered calls further out than a month or two and selling covered calls at the peak times, buying them back at proper times and knowing when to do absolutely nothing.
Patience is key to profitable selling of covered calls if the desire is to own the underlying stock forever. As well because of tax structures, it often does not make a lot of sense to be exercised from your stock too often and then buy back in immediately after being exercised. Many times the buying and selling of the same stock in a short time span will be considered income and not capital gains and as such the income tax rate will be higher.
Therefore selling covered calls and avoiding exercise of stock is a strategy that requires a little bit of planning in advance, but through use of the fast stochastic an investor can benefit from this simple strategy.
This is the topic that a reader touched upon recently when he sent me an email regarding his Johnson and Johnson stock holding.
Johnson and Johnson Stock Reader Question
I have sold puts primarily, but have decided to start to acquire some stocks on dips to establish a retirement dividend growth portfolio. This account is not an IRA though. When JNJ dipped on April 18, I purchased 500 shares for $63.5 and two days later on April 20, I sold 5 covered calls for May 18, at a strike of $65 (JNJ 20120519, $65, CALL) for .17 cents. My goal is to keep JNJ stock and accumulate more on pullbacks, collect dividends and write covered calls along the way. How would you proceed now that it has recovered to slightly above $65? Ted.
Dividend Stocks Outside A Retirement Portfolio
One comment before I start has to do with the dividend growth concept. I prefer my dividend stocks to stay outside a retirement portfolio. The dividends I receive are given preferential tax treatment as the company itself has already paid income tax on their earnings before declaring the dividend. Most of the dividends I receive flow through to me tax-free. Having a dividend stock within a retirement account does not give me too many dividend tax breaks although I certainly do get a break on any capital gain in the stock.
Johnson and Johnson Stock Chart
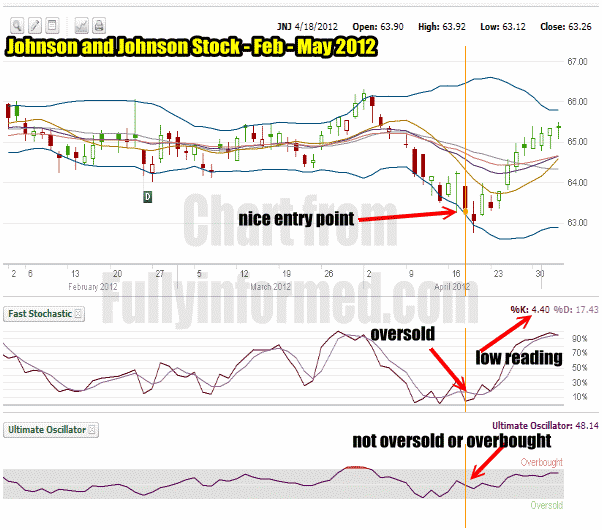
The first thing to notice from the chart below is that Ted bought the shares at a nice entry point. The mistake Ted made here was not using the Fast Stochastic possibly with the ultimate oscillator to time the selling of the covered calls in Johnson and Johnson stock. The chart below shows that the fast stochastic was deeply oversold with a reading of 4.4. Very nice entry point based on the fast stochastic.
Note how the ultimate oscillator is neither oversold or overbought at that moment. This is why the fast stochastic is so good for timing entry and exit points in a stock like Johnson and Johnson. The Ultimate Oscillator is slower to react than the fast stochastic. Based on the ultimate oscillator readings below, if Ted had waited for an oversold indication from the Ultimate Oscillator, he would not have received one.

Johnson and Johnson stock chart for Feb - May 2012 - Covered Calls Trade
Covered Calls On Johnson and Johnson Stock
When selling covered calls an investor has to decide before selling the covered calls, what the purpose of the trade is. If the goal is to earn income but never lose control of the shares than you need a different strategy from someone who is buying stock and simply wants to sell covered calls, earn from income and be exercised out of the stock and start all over again. There are many different strategies for covered calls that can be used. In this case, Ted wants to keep ownership of his Johnson and Johnson stock, but he wants the advantages of selling the covered calls to rent out his stocks as it were. There is nothing wrong with renting out your Johnson and Johnson stock. The problem is, just like with rental property, you need to check out the future tenants to see if they are suitable to rent to.
When you rent out your Johnson and Johnson stock you are basically giving someone the right to take away your shares at a set price. That price is the covered call strike you sold your Johnson and Johnson Stock for. Just like tenants we need to look at the history of a stock.
Johnson and Johnson Stock Price History
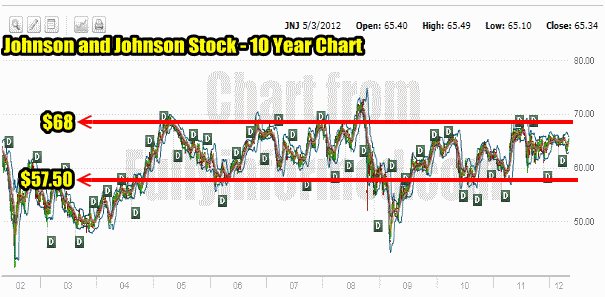
Below is Johnson and Johnson stock price history for the past 5 years . The first thing I like to do is draw a line marking the average of highs the stock has reached. I then like to draw another line marking the average of lows the stock has reached. By doing this I can see that Johnson and Johnson stock has had highs around $68.00 and lows around $57.50. Most of the time though Johnson and Johnson Stock has been in-between those two values. I usually ignore the extremes such as the bear market collapse of 08-09 as they will not assist my covered call writing against Johnson and Johnson Stock.

Johnson and Johnson Stock 5 Year Price Chart
Next I open up a 10 year Johnson and Johnson stock price history chart to confirm what the 5 year has shown me. Interestingly the $68 marks a fairly stable high value for Johnson and Johnson Stock and $57.50 is certainly a good low point for the stock although in 2002 to 2004 there were lower valuations.

Johnson and Johnson Stock 10 Year Price Chart
Immediately because of the above two charts I know that $68.00 marks a pretty high level for the stock. It could easily move above $68.00 but how long would this last? You can see by the 5 and 10 year charts that Johnson and Johnson Stock is not in a long-term uptrend. It is basically moving sideways with a slight bias up. Therefore the high level of $68.00 if probably quite accurate unless something dramatic should happen with Johnson and Johnson Stock.
Johnson and Johnson Stock and Fast Stochastic For 1 Year
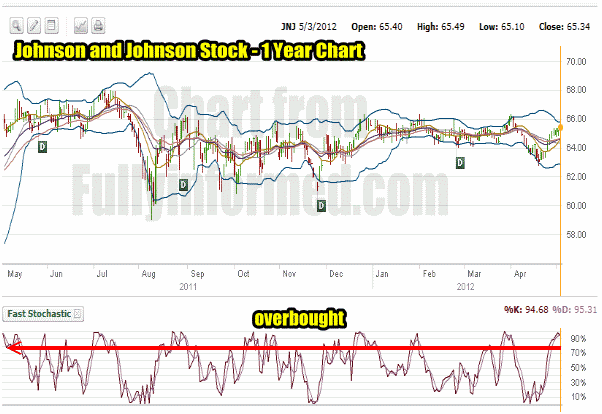
The final thing I do is open up the 1 year fast stochastic chart with Johnson and Johnson Stock. I then draw a line at 70%. Anything above 70% normally marks an overbought condition in the stock. Usually an overbought condition will be followed by the stock dropping or pulling back. This is exactly what I want as a covered call seller who does not want to lose his shares of Johnson and Johnson Stock.
Looking at the chart below I can see that during the past 12 months there have been 12 times that the stock reached overbought. This means that I could have sold covered calls on Johnson and Johnson Stock 12 times during the year. That is more than enough to earn income. Each overbought indicator was then followed by an oversold indicator as the stock fell. This too is perfect for that means that with each pullback I would have a good opportunity to buy back my shares and not be exercised out of the stock.

Johnson and Johnson Stock 1 Year Price Chart
One other piece of information should be taken from the above chart. When I sell a longer term covered calls, say 3 to 6 months, even if the stock runs up higher I should have time for the stock to fall and buy back my covered calls protecting my Johnson and Johnson Stock from exercise.
Based on the fast stochastic information, let’s look at what Ted has already done with his Johnson and Johnson Stock trade.
Johnson and Johnson Stock Premium Covered Call Selling
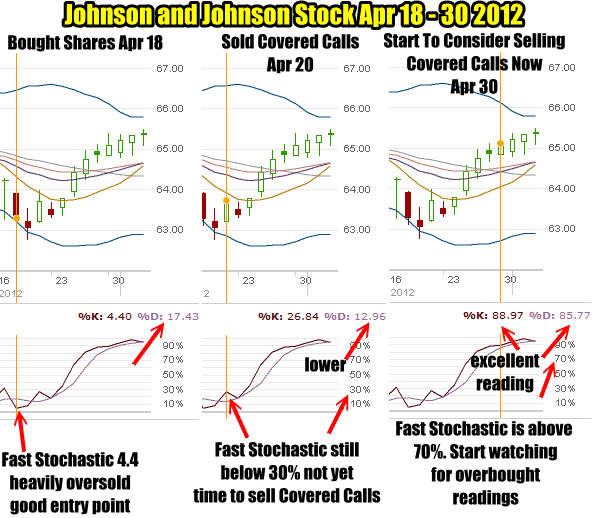
Look at the Johnson and Johnson Stock chart below. I have put up the day Ted bought shares, the day he sold his covered calls and the day when he should have started to consider selling covered calls. Here is what Ted did wrong. April 18 2012 the Fast Stochastic was very oversold with a %K reading of just 4.4. The %D reading was 17.43. Before going further let me explain how the fast stochastic is being used for covered call writing.

Johnson and Johnson Stock Covered Calls Selling Decision
Johnson and Johnson Stock and Understanding The Fast Stochastic
To understand the above chart it is important to know how %K and %D relate to the fast stochastic. While not always accurate, understanding what %D and %K mean can assist in selling covered calls (and buy and sell stocks and sell puts). The Fast Stochastic is designed to predict an uptrend or a downtrend in a stock. In most charting programs such as the one you see above, the darker or thicker line is %K and the thinner or dotted line is %D.
There is a lot more to the fast stochastic then what I will explain here, but the easiest description would be to say that %K Line usually changes direction before %D. But when %D changes direction before %K, then a reversal in a trend is being predicted. This is a very simple understanding of the fast stochastic but for covered call selling it may be all that is needed.
April 17 2012
Johnson and Johnson stock reading on April 17 was %K 31.35 and %D 16.21. According to the fast stochastic then the stock will continue to fall.
April 18 2012
On April 18 when Ted bought shares the %K was 4.4 and the %D was 17.43. The %K is lower than %D which should indicate a reversal in the trend of Johnson and Johnson Stock back up.
April 19 2012
Johnson and Johnson stock was lower on April 19 but %K was 7.63 and %D was 14.46. Both are rising and indicate the stock will move higher.
April 20 2012
This day is in the chart above. On April 20th Ted sold his covered calls for .18 cents, but Johnson and Johnson Stock showed a fast stochastic reading of %K 26.84 and %D 12.96. %K is higher than %D which would indicate that the fast stochastic is advising the stock will move higher. Ted should not have sold his covered calls on this day. Johnson and Johnson Stock is moving higher which will give him better covered call premiums and Ted will also have less chance of selling a covered call which may end up in the money. In other words it is better to wait until the uptrend in Johnson and Johnson Stock stalls before selling covered calls. As well with a reading of 26.84 the fast stochastic is not above 70% which should be the first point to consider selling covered calls.
April 30 2012
This day is in the chart above. The fast stochastic reading on Johnson and Johnson Stock is above 70% with a K% of 88.97 and a D% of 85.77. Both readings are close and covered calls could be considered. However you may want to wait for the K% reading to be lower than the D% reading which would indicate that the stock is about to break the uptrend and stall or pullback.
May 1 2012
Johnson and Johnson Stock reading from the fast stochastic is %K 93.54 and %D 90.09.
May 2 2012
Johnson and Johnson Stock reading from the fast stochastic is %K 97.72 and %D 93.41
May 3 2012
Johnson and Johnson Stock reading from the fast stochastic is %K 94.68 and %D 95.31. The %D is higher than %K which would indicate that the stock may stall here or fall back. With Johnson and Johnson Stock at $65.34 Ted could consider selling the July $65 covered call for $1.29 or even the May $65 for .71. When the stock falls and the readings finally point to a bottoming of the stock selling, you can consider buying back the covered call for less than what was earned and then wait for the cycle to repeat.
Just to re-state, it is important to understand that the above is a simple overview of the fast stochastic. However in my personal use I have found it compelling enough to use it for covered call writing. As well once Johnson and Johnson Stock pulls back it is important to use the fast stochastic to monitor the movement of the stock. The stock can drop but it can also drop and then recover placing the covered calls once more into a position of possible assignment. When the goal is to not be assigned shares it is important to be consistent when writing the covered calls and buying to close the same covered calls.
Therefore based on the above chart, if Ted had waited until today when the fast stochastic is indicating a probable change in the trend of Johnson and Johnson Stock, he could have selected July $65 covered calls and sold them for $1.30 or 2% to July. That marks 3 months out and based on the above chart there should be ample times during the next 3 months when Ted can buy back his sold covered calls for a very nice profit and wait for the fast stochastic to signal overbought again, before selling his covered calls once more.
If each time Ted pays .25 cents to close the covered call contracts, he will still have earned $1.05. If Ted does this 4 times during the year he will earn $4.20 or 6.6%. Add this to Johnson and Johnson Stock annual dividend of $2.28 total earnings could be $6.48 or 10%.
Advantages Of Selling Covered Calls On Johnson and Johnson Stock Beyond 2 Months
There are several advantages to selling covered calls beyond 1 or 2 months including less commission to be paid. As well by selling covered calls beyond 1 month it allows for more chances to be able to buy back the covered call for a profit in the event that the stock rises. If the period if 3 months for example, and the stock rises beyond the covered call strike in month 1 there are still two other months in which the stock may pullback and allow me to close the covered calls without exercise of my Johnson and Johnson Stock.
This also means that if the stock should run up to my covered call price at the time of options expiry, I can buyback my sold covered calls and sell covered calls at the same strike further out in time or just the next strike up, because I have a better than average chance that the stock will pullback and I will be able to buy back those covered calls for pennies and then repeat the process.
Johnson and Johnson Stock And Ted’s Covered Calls Decision
So what would I do if I was Ted? The actual price Ted paid for the Johnson and Johnson Stock is now immaterial. Ted bought his Johnson and Johnson Stock for a long-term dividend portfolio. He now only cares about earning income from the shares. Perhaps Ted will never sell his Johnson and Johnson Stock but instead leave them to a family member for them to continue the process.
As of today Johnson and Johnson Stock closed at $65.34. Ted could decide to either start a proper covered call portfolio now or wait to see if the stock falls lower before options expiry later this month. Below are my two suggestions for retaining control of his Johnson and Johnson Stock.
Scenario A: Johnson and Johnson Stock $65 Covered Calls May 19 Expiry Sold For .17 cents – Don’t Wait
Why wait. I could start my portfolio building now. Looking at the fast stochastic information presented above I can see that Johnson and Johnson Stock is overbought. I can buy back the May $65 covered calls for .74 cents and then sell either the July $65 for $1.29 or go out to October and sell the $67.50 covered calls for .86 cents. Because I believe in the fast stochastic and the knowledge that stocks fluctuate a lot I am confident that Johnson and Johnson Stock will pullback before July Options expiry and I can buy back my covered calls and then wait to sell them again.
Scenario B: Johnson and Johnson Stock $65 Covered Calls May 19 Expiry Sold For .17 cents – WAIT
With the fast stochastic reading above I know that a lot of the movement higher in Johnson and Johnson Stock has been caused by analysts and the tv pundits who are talking up a storm now about Johnson and Johnson Stock. As well JNJ Stock just raised its dividend which will draw investors to the stock for a while yet. But the fast stochastic is flashing a change in trend. I think I might wait for a bit to see if the stock falls and I can buy back the May options before or by expiry. If I do then I will wait until the next extreme overbought reading to sell my next round of covered calls on Johnson and Johnson Stock. At the same time if the stock by May Options expiry is above $65 I will buy back my covered calls and roll them into July. It is important to remember that the next dividend payout on Johnson and Johnson Stock is May 23. I must make sure when I roll my covered calls into July that there is at least .57 cents premiums between the price of the covered call I receive and the price of the stock, otherwise I could get exercised from my shares on May 23. This can happen because other investors who own the covered call will want the stock to earn the dividend and then sell the stock a few days later.
If the stock is around $65.00 by May 19 I would be tempted to roll out to October and select $67.50 for the call strike but only if I can do this for a net credit. While the premium earned from the covered call is less it places me back at the high side of the charts from above where I indicated that $68.00 was at the high-end for the stock.
Johnson and Johnson Stock Covered Calls Summary
If this was my trade I would be doing scenario B above because I like Johnson and Johnson Stock and with the fast stochastic signalling trend change the stock could easily pullback and fall below my May $65 covered call strike. Whatever the outcome I would from this point forward make sure that I sell covered calls based on the technical indicators like the fast stochastic so I earn the highest premiums I can and give myself the very best chance to not be exercised out of my shares of Johnson and Johnson Stock.
Visit Johnson and Johnson Stock Investor Relations
View More Profit And Income Strategies Articles

