Cisco Stock as investors know by now had a poor last quarter and provided what really amounts to an abysmal forward looking statement. There is quite a bit of truth to the problems for tech companies in China over the NSA fallout. Cisco is not the only company to be experiencing problems with sales in China, but they certainly made a point of making sure investors knew of the ongoing problems. At the same time though, Cisco also has a massive share buy-back underway and does seem poised to also become a major dividend stock for investors. That said let’s look at Cisco stock after the plunge and see what Put Selling opportunities may look like going forward.
When a stock like Cisco collapses the natural tendency is to look at the stock, find support levels and sell put contract against the decline for exceptional put premiums. However what happens when you sell put strikes like $21, $20 or $19 and the stock falls to $14? Most investors will get shaken out of their positions, take losses and move to another stock. Instead I like to know in advance what I might expect and what I will do in the event that the unexpected should happen.
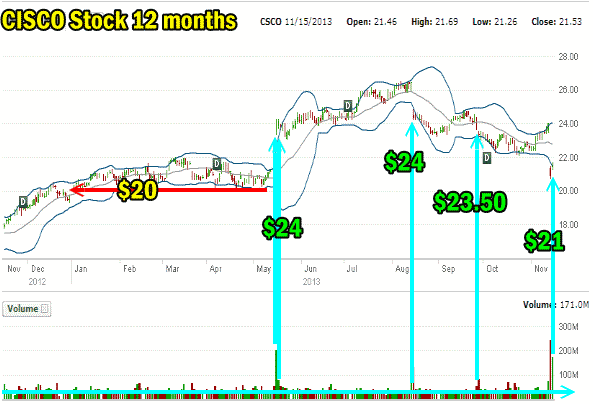
To start I look at the 12 month daily chart.
Cisco Stock 12 Month Chart
The 12 month chart below shows some interesting aspects of Cisco Stock and where investors in general are positions. If we work from volume and price we can see that earlier this year until May Cisco Stock had daily volumes that were of average size. This occurred day after day, week after week and month after month. Cisco built up quite the support at $20.00.
The rest of the year we can see some other interesting information. A lot of investors have purchased at the $24.00 level with fewer investors sitting at $22.00, $23.50 and recently after the stock plunge at the $21 level. If we take out the volume from the last two days, the majority of shares traded hands at $20.00 and the second largest volume at $24.

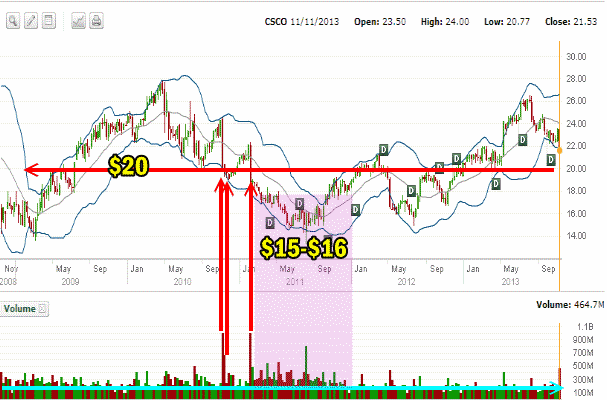
Cisco Stock 5 Year Chart
What we want to do now is see just how much support there really is at $20 in Cisco Stock. To do that we want to go back 5 years and look at how much volume we can see at $20.00. Over the last 5 years the stock has actually had reasonable volume at the $20.00 level. In 2009 when the stock recovered is shot up over $20.00 and stayed there for almost half of 2010. In 2011 it was briefly above $20.00. Then in this year the stock saw $20 again. So there is reasonable support at $20.00 and we could use that level as sort of the pivotal point for options. In other words I could use the $20 put strike as my central focus and feel pretty secure that if the stock slips below $20 it will recover at some point. This is excellent as it helps when Put Selling so I don’t get shaken out of my position should the stock fall lower.

What The Charts Say
This also tells me other things as well. I am presently holding naked puts at $21, $20 and $19 which I sold on Thursday morning near the open. Looking at the above charts Cisco stock will hold up probably above $21 in a strong uptrending market, but any correction in the present bull market and this stock will probably quickly fall below $21. Looking at the charts above I know that I can roll down my $21 put strike if Cisco stock pulls back below $21. I also know that I can hold onto my put strikes at $20 and $19. Therefore if the stock falls below $21.00 I would buy back the $21 naked puts and sell enough puts at $18 to cover the cost to buy back the $21 naked puts and roll down to $18.
The other important information I have learned from the 5 year chart is that if the stock should correct down to $15 to $16 in value, it would be worth selling in the money puts at $16 as during both the bear market of 2008 to 2009 and the severe correction in 2011, Cisco Stock fell that low and recovered.
Selling In The Money Put Options
Selling in the money put options if Cisco Stock fell below $16 would be worthwhile. I would sell the $16 put strike even if the stock fell to $14 or $13. I also would not roll down the $20, $19 and $18 put strikes but instead I would immediately roll them further out at those strikes with $20 being the top end. By doing this, even if I do not take into account whatever income I had earned through selling puts, my average cost basis would be excellent in Cisco Stock. For example what about if I had $76,000 of capital to invest in Cisco Stock. My position might look like this:
7 naked puts at $20 = $14,000
10 naked puts at $19 = $19,000
15 naked puts at $18 = $27,000
10 naked put at $16 = $16,000
Total capital committed = 76,000
Number of shares if assigned on all positions = 4200
Average cost per share = $18.09.
If we look at the chart above over the past 5 years, I could easily sell covered calls at $18, even 6 months to a year out and the chance of being exercised from my shares is very high as the stock has often trade up to and higher than $18.00 over the last 5 years.
The above of course can be structured to whatever capital an investor had available. How about just $42000.00 available. The set up might look like this.
2 naked puts at $20 = $4,000
4 naked puts at $19 = $7,600
8 naked puts at $18 = $14,400
10 naked put at $16 = $16,000
Total capital committed = 42,000
Number of shares if assigned on all positions = 2400
Average cost per share = $17.50
An even smaller portfolio of perhaps $25,000 might look like this:
2 naked puts at $20 = $4,000
3 naked puts at $19 = $5,700
4 naked puts at $18 = $7,200
5 naked put at $16 = $8,000
Total capital committed = 24,900
Number of shares if assigned on all positions = 1400
Average cost per share = $17.78
Structure The Put Selling In Whatever Valuation Is The Most Comfortable
The last two examples have an investor below $18.00 which again is a very good valuation. You can see then that by structuring the number of put contracts sold at each strike, an investor is able to decide on whatever valuation they think the stock is worth. Once the strategy is put in place the investor simply keeps rolling the entire position forward. If the stock falls lower that $16.00 for example, an investor would immediately roll out further into time the puts that are caught in the money. By rolling out and staying ahead by two or tthree-month I have found the chance of assignment of shares is greatly reduced. Many times I am rolling 6 months out each time and when there are two months to expiry, I roll once again out 6 months.
Last Adjustment To Cisco Stock Put Selling Trade
The other thing the above trade does provide is a level of comfort that keeps from getting shaken out of the trade. If the stock falls all the way to $14 for example, I would not be concerned about my puts at $20.00 as first I am actually in the stock around $18 and second the evidence of the past 5 years shows that the stock does return to $20 valuation more than once. It actually returns to $20 many times. Therefore if the stock should fall leaving my naked puts deep in the money the first step once I rolled my $21 naked puts down to $18 would be to begin rolling further out in time.
Determining How Far Out In Time to Roll Naked Puts
Many investors base how far they will roll out in time against how far in the money their puts are. For example if I was holding the $20 strike with naked puts and the stock fell to $14, I want to do everything I can to delay being assigned shares. Therefore I would roll my $20 naked puts out to the first leaps or basically one year. The $19 and $18 I would probably roll out to 6 months minimum but the $16 I would keep rolling just 1 or 2 months out because if I was assigned shares at $16 I would have no problem owning them and starting already to sell covered calls to be exercised out. However based on the charts above if I was assigned at $16, I would sell covered calls at $17 or $18 depending on the premium I could earn.
Summary of Put Selling After The Cisco Stock Plunge
You can see then that by studying the past history of a stock like Cisco I can create a plan based around my level of comfort. This plan incorporates a rescue strategy, a strategy to avoid assignment in the event the stock falls deeply and a strategy for getting back out of the stock should it collapse further. By studying the chart history of a stock I can get a better understanding of what to expect, where major support is, which put strikes to roll lower, which put strikes to roll sideways plus I know what the future of the stock may bring as well.
All of this keeps me away from taking losses if Cisco Stock should fall further than anticipated. I cannot be shaken out of the puts I am holding because I have a plan in place to continue to profit from my positions no matter what the stock should throw my way.
This is the great thing about studying the chart patterns in advance of doing a trade and of having a goal and then a plan to meet that goal already established before the very first put contract is even sold on Cisco Stock. By knowing the history of Cisco Stock I have a good chance that I will know in advance what the stock may end up doing and how I will react to any valuation in Cisco Stock.
Internal Stock and Option Trades Links
Put Selling Strategies For Members
Covered Calls Strategies For Members
Profit And Income Strategies Index
Stock and Option Strategies For Members
Stock And Option Trades Explained For Members

