 PepsiCo Stock is a one of my favorite stocks as many readers of fullyinformed.com know. In the PepsiCo Stock article I wrote on Feb 15 2012 I explained how studying past charts on stocks like PepsiCo gives me an understanding of where support and resistance might lie within a stock. This makes put selling and covered call selling easier. When looking at charts I like to go back a few months and other times more than a couple of years.
In the case of PepsiCo Stock, I went back to 2009 and followed the stock from the March 2009 Bear Market crash to the present. This gave me a lot of understanding of where many buyers are sitting with PepsiCo Stock. Put selling which is my main investment strategy, is not a favorite of many investors. Most investors like to buy and sell stock and many just like to buy but never know where or when to sell.
I truly do not see a lot of value, in a stock paying a 3 or 4 percent dividend, for investors to buy, watch it run up, wonder if they should sell and then watch it run back down.
This “strategy” seems to covers the majority of investors. I on the other hand want to compound my money constantly. To do that I cannot buy a stock and just earn the dividend. I have to sell puts on weakness, buy stock on weakness, sell covered calls in strength and sell stock on bounces.
PepsiCo Stock Trades To Date
To that end let’s see how my PepsiCo Stock Trades are working out so far.
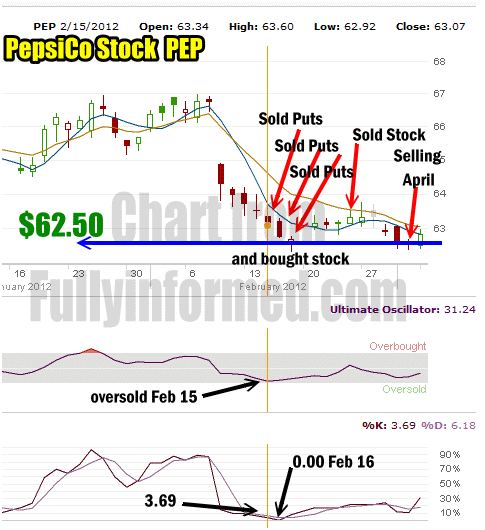
On Feb 15 when I wrote the article on PepsiCo Stock I commenced a string of put selling for March options expiry. Every day I did put selling on PepsiCo Stock. I then entered into buying PepsiCo Stock when it broke through $62.50 on Feb 17. Four trading days later I sold my shares but I am continuing to hold my March $62.50 puts. Meanwhile I used margin to sell the March $60 PepsiCo put strikes for smaller returns or about half a percent.
I am comfortable using margin for this. Unless I am assigned, the margin costs me nothing to use but allows me to sell a lot of March $60 put strikes for small gains which will assist in making this PepsiCo Stock trade very profitable. I look at my March $60 puts as “icing on the cake” so to speak.

- PepsiCo Stock Chart showing the stock’s fall in Feb and the subsequent trades I have done.
PepsiCo Stock Trade Includes The Fast Stochastic and Ultimate Oscillator
To assist throughout this trade I have used the Fast Stochastic and Ultimate Oscillator technical timing tools. If you look at the chart below you can see why I was selling puts and why after Feb 16 I bought shares for a quick bounce.
On Feb 16 the Fast Stochastic Timing Indicator flashed a 0.00 reading. This is an extreme reading which told me that a bounce is imminent. I saw the 0.00 reading at the close on Feb 16. The next day, Feb 17 I bought 3000 shares of PepsiCo Stock for an average cost of $62.48. I bought the shares in three 1000 lot purchases at and just below support. I missed the low, but true to the charts, PepsiCo Stock closed at $62.68 that day. That marked a test of support and the smart money traders moved in over the next couple of trading sessions to buy the stock.
Why I Use Both The Ultimate Oscillator and Fast Stochastic
The Ultimate Oscillator flashed the oversold on Feb 15 and then began a climb which as you can see has not brought the Ultimate Oscillator back to a firm oversold signal since Feb 15. Even when PepsiCo Stock fell through the $62.50 support on Feb 17 note how the Ultimate Oscillator was already climbing and it did not pull back.
The Fast Stochastic flashed an incredible 0.00 on Feb 16, but the Ultimate Oscillator was already advancing. This advance in the Ultimate Oscillator was telling me that the smart money was buying PepsiCo Stock which is why the Ultimate Oscillator was advancing.

PepsiCo Stock showing Ultimate Oscillator and Fast Stochastic Readings
PepsiCo Stock Trade Strategy
The strategy behind these trades is based completely on the review of support and resistance from my PepsiCo Stock article of Feb 15. In that article I calculated the downside if support breaks of $62.50 to be perhaps to the $60.00 strike. By buying 3000 shares right near $62.50, if the Fast Stochastic and Ultimate Oscillator signals were incorrect, then I calculated that I might end up selling 30 covered calls at $62.50 and earning the next dividend while waiting for the stock to recover
I felt the downside was so limited that it was very worthwhile selling puts all the way down and buying the stock. At that point with my readings showing so much strength at $62.50, I saw no reason to be concerned that if the $62.50 support level broke, that the next level of support at $60.00 would break as well. Because of this confidence I decided to use margin to sell the $60 strikes
On that day I used margin to sell a lot of March $60 puts for .30 cents. While this is just half a percent, it was costing me nothing since it is margin. Only if the shares were assigned to me would I have to be concerned about paying interest on the margin. I felt the likelihood of this was very low and I also felt that if the stock should fall by March options expiry, I would buy back the $60.00 strike puts and roll then further out in time and reduce the number of put contracts I would sell
I could tell that I was definitely not the only investor put selling the March $60.00 puts. Today when I closed my March $60 puts for .03 cents the volume was over 2,000 contracts.
Meanwhile the Fast Stochastic was correct and the extreme reading was followed by a bouce in the stock during which I unloaded all my shares. I am still holding my March $62.50 puts, and now I am put selling the April $62.50 and $60.00 strikes.
The bounce after such a low reading in PepsiCo Stock is classic for the Fast Stochastic. I have seen this extreme reading many times and in the majority of cases, the stock bounces. The bounce took place and now PepsiCo Stock is back down to support at $62.50. This makes put selling into April a lot easier for reasonable put premiums.
The past two days in PepsiCo Stock is being reflected by a recent spike up in the Fast Stochastic which you can see above. Whether or not the $62.50 support will hold into April is a tough call at this point. I will need more days to watch readings from both the Fast Stochastic and Ultimate Oscillator to tell me where the next move may be. If however the $62.50 should break, I believe the chance of PepsiCo Stock falling below $60.00 is incredibly slim. It is for this reason that I have the confidence to commence selling the April puts.
PepsiCo Stock Trade Summary
The reason I am posting these types of trades is to show readers that it is not necessary to chase high-flying stocks, penny stocks and questionable junior stocks, to earn decent returns. My trade on PepsiCo Stock, and recent trades on Kraft Stock, Bank Of Nova Scotia (BNS) and Fortis Energy (FTS on Toronto) show that good returns can be made on strong stocks. I would rather risk buy 3000 shares of PepsiCo Stock based on my above charts than risk the same amount of capital on most juniors or certainly any penny stock.
With the PepsiCo Stock trade, what is the downside? That I might end up owning shares at $62.50 and watch the stock fall to possibly $60.00 or the 2011 low of $57.50. All of those levels can be easily made profitable with covered calls. But I cannot say the same for most juniors.
So while a lot of investors complain about the low volatility and possibly decide to step outside the realm of big caps into perhaps more questionable stocks as they seek better returns, I am writing these articles to show that stocks like PepsiCo Stock have great profit and income opportunities with a lot less risk.


