Yum Stock has been in my portfolio since 2009. A star performer for Put Selling and a handful of Bollinger Bands Strategy Trades, YUM Stock continues to not only shine but it is bringing in enormous profits. The number of trades done this year in YUM Stock often reached a point where 25% of my entire capital base was being committed. The returns have far outstripped anything made to date through Put Selling YUM Stock.
Part of the reason for this is the increased volatility in YUM Stock caused by the problems in China which has whipsawed worried investors. The other reason is a clear understanding of the technical analysis of YUM Stock and where support and resistance is within the stock.
Today a FullyInformed Member asked me about YUM Stock following my trade yesterday. I replied in the member’s section, but I thought I would share some of the information in the regular website as well.
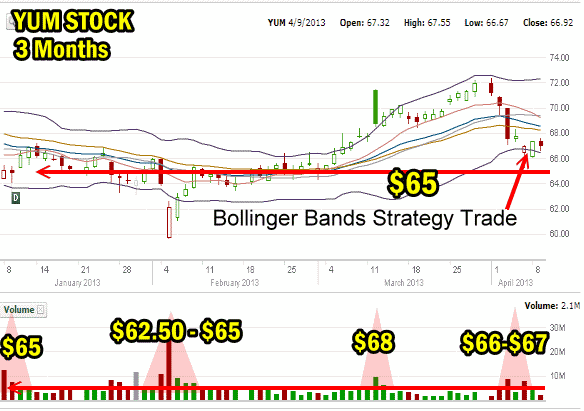
YUM Stock 3 Month Chart
In quite a few articles I have discussed Key Support levels in YUM Stock. Among those articles I have also mentioned the Bollinger Bands Strategy Trade. Yesterday I entered the Bollinger Bands Strategy Trade on the bounce back from the Lower Bollinger Band. The reason for the trade is pretty obvious. Support in YUM Stock sits at $65. The last big sell-off in YUM Stock over the “Chicken Scare”, was at the start of Feb and you can see in the volume chart that the stock immediately returned to the $65 support level. This $65 level has been a support zone for YUM Stock for quite some time. Based on Volume and Price you can see in the chart below that above average days is showing good support for the $65 level.
Yesterday’s trade lasted only the day as when I bought the shares of YUM Stock I also put in my order to sell at $67.30 as explained in my trade alert from the morning and it was filled later in the day when YUM Stock shot up. So that trade is over for now.
But Pat’s question I think is more on the YUM Stock Put Selling comment where I indicated that the $65 put made sense for .95 cents. This is because the put trade was just a little less than two weeks and with support still holding at $65 the chance to profit from that put makes a lot of sense. Recalling that selling naked puts does not mean holding them until expiry, the put today could have been closed for .55 cents for a 42% return, which is why I commented that the put trade at $65 might be the safer trade. Comparing my return of $1.00 against $66.30 for a gain of 1.5% versus a return of 42% for a day in the $65 naked puts tells me that the $65 was probably the safer bet.

YUM Stock 3 Month Chart
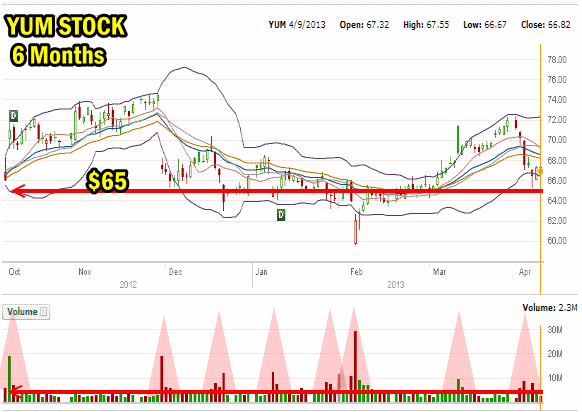
YUM Stock Chart 6 Months
If we go out to the 6 month daily chart on YUM Stock, you can see how strong the support is at $65.00. This is part of the reason why when the stock pulled back in Feb as investors panicked, I immediately bought shares, sold puts and sent out trade alerts and trade ideas. That was a prime opportunity.

YUM Stock 6 Month Chart
YUM Stock Technical Tools Indicators
Let’s quickly also look at yesterday’s technical indicators to see what I saw in the stock.
A. YUM Stock had held the Lower Bollinger Band, not fallen back to test support at $65 and was pushing back up. A clear signal to buy the stock for a bounce back using the Bollinger Bands Strategy Trade. Also a great chance to sell the April 20 expiry $65 Put for .95 cents.
B. Momentum was back rising.
C. Oversold indicator from the Slow Stochastic and a buy signal on the verge of being triggered as K period was crossing D period and K period is higher than D period.
D. MACD is negative and continues to signal lower values ahead.
E. Ultimate Oscillator was turning back up and signaling 49.63 or almost positive.
F. The Fast Stochastic had already triggered a buy signal on Friday Apr 5 and was now signaling stock up as the K period is higher than the D period.
With all but one indicator pointing to the stock rising, I did the trade and sent out the trade alert.

Buying To Close Early On Naked Puts
It needs to be remembered that when puts are sold there is no fast rule that says they must be held until expiry. Yesterday’s Put Selling trade at the $65 strike is a prime example. An investor could have traded the April 20 options expiry at the $65 strike for a gain of .95 cents and closed today for .55 cents. Indeed each day that passes will erode that put quickly, especially over this weekend, if the stock stays at or above $65.
The remainder of this technical analysis of YUM Stock is for FullyInformed Members. Members can can login directly through this link to read the rest of this YUM Stock strategy article or Members can sign in to the full members site here. Non-members can join here.

