
Regular readers of FullyInformed.com know that I use the Weekly Initial Unemployment Insurance Claims as a market timing system. This market timing system has a proven track record which I have benefited from for years. For anyone unaware of this system you can read how this market timing system works through this link. You can also review all the market timing articles through this index and finally, you can review all the weekly unemployment market timing system through this category.
Today’s Weekly Initial Unemployment Insurance Claims
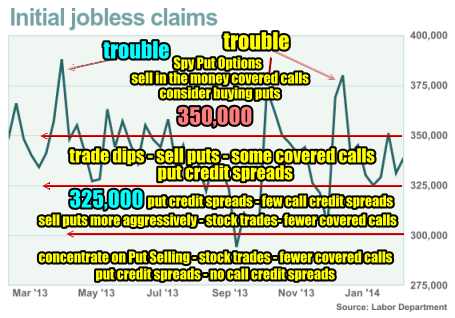
The Weekly Initial Unemployment Insurance Claims numbers moved to a new 3 month low coming in at 315,000. That’s the second week of declining numbers which bodes well for stocks. Analysts had expected the Weekly Initial Unemployment Insurance Claims for Mar 8 to come in higher, at around 330,000 so today’s numbers were good news. A lot of analysts believe the numbers are improving after the recent bout of bad weather had kept employment opportunities under wraps.
Inflation Up
The other bit of news came from the inflation front where a second report showed import prices rose more than expected and recorded the largest gain in a year this past February. It was primarily due to petroleum increases rather than sign of broad-based inflation. Still for the Federal Reserve this could be another signal being watched so it tough to say what will occur next week at their meeting.
Trading Based on Weekly Initial Unemployment Insurance Claims
The numbers from Thursday are telling me as an investor that the chance of a broad-based collapse or topping of stocks at present is extremely limited. That does not mean we won’t have further weakness as there are always other factors such as the Ukraine crisis and the disappointing news of reduced growth out of China which can keep stocks weak. But as a market timing system, it is rare when we will see a plunge in stocks and the start of any kind of bear market. In other words I will continue trading and staying with my strategies. My capital will continue to be allotted to my trades.
Below again is my chart showing the trading patterns I follow based on the Weekly Initial Unemployment Insurance Claims.
Market Timing Signals Based On Unemployment
We are now half way between the 300,000 to 325,000 numbers which means selling puts a bit more aggressively, considering put credit spreads, doing fewer covered calls and even fewer call credit spreads.
Market Direction Outlook Then Is…
To cut through to an outlook for trading, I see nothing that tells me the market is about to implode, plunge or collapse. There are no signals from the market timing system based on unemployment that I use, that shows any significant collapse is impending. Next week I will review the Weekly Initial Unemployment Insurance Claims once again for clues to any change in that outlook. Next month’s unemployment report for the month should be quite interesting.
Internal Market Direction Links
Profiting From Understanding Market Direction (Articles Index)
Understanding Short-Term Signals
Market Direction Portfolio Ongoing Trades (Members only)