Spy put options can provide a terrific profit if the investor understands the importance of his having confidence in the market direction at the time of committing capital to the spy put trade. If however, the investor is going to hesitate when deciding to purchase his spy put contracts, the profit picture can change dramatically. The spy put options which is one of the SPDR 500 ETF products, rapidly changes as it follows the S&P 500 index.
This morning for example, the S&P 500 hardly moved several times, yet the SPY PUT options premiums fluctuated back and forth by nearly 7 cents without any movement in the S&P 500 itself. This is caused by the SPY Put ETF trying to follow the S&P 500 but also reflecting the volatility in the market as well as put options interest among investors.
When many of the SPY PUT trades are earning just .20 or .25 cents., hesitation on the part of an investor can have a detrimental impact on the profit outcome of the trade.
Final Spy Put Trade For May 30 2012
My final Spy Put Options trade for today shows why it is important to have confidence in the market direction for the day. My earlier articles today discussed the waterfall effect which the S&P 500 was exhibiting. This is a clear signal that the market direction for the day will be down. That means all rallies are considered for buying spy put contracts to take advantage of when the rally fades.
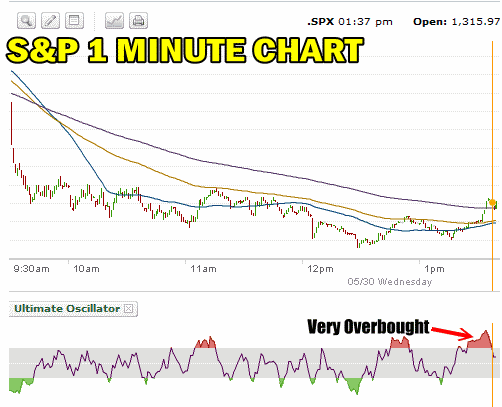
Since I have confidence that I know what the market direction will be for the day, I am then waiting for rallies to push up the S&P 500, give the ultimate oscillator the overbought signal and allow me to buy my spy put contracts for a move back down.
Knowing When To Buy The Spy Put Options
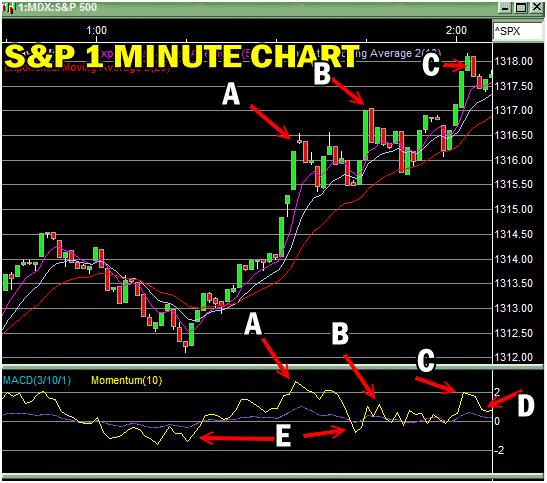
The S&P 500 and momentum chart for the final spy put trade is below. following my selling of the first set of spy put contracts, the S&P 500 fell even further after I sold my put contracts. Then it bounced and began a climb higher.
In order to understand the final spy put trade and how to determine when to buy the spy put contracts on the rallies, I have marked the key points in the S&P 500 chart below.
A) The first stop in the climb was point A. I have also marked point A in the momentum chart which is attached to the S&P 500 chart. Point A shows the very best rise in momentum. From Point A forward, the continued rise in the S&P 500 was not reflected by climbing momentum.
B) The selling after point A was reached was shallow as far at momentum was concerned. As well the second high marked by point B saw much lower momentum which is a sign that the rally is running out of steam.
C) Indeed by point C, the market tried to push hard to get higher but momentum was lower than point A and was just a short spike up.
D) When point C failed to continue with momentum higher, I bought my spy put contracts at point D when momentum turned down.
E) Point E shows that the first pullback after point A was much shallower than the other momentum indicators when the market had pulled back. This tells me that the S&P 500 will probably climb further. However when the S&P did climb but momentum did not reflect that higher high, I knew it was only a matter of a time before the market would stall and begin to erode again.
Remember the market direction for the day is the single most important factor and I believed from the waterfall effect that the market movement would be down all day. Therefore any rally of significance should be an opportunity to buy spy puts for the move back lower.

The final Spy Put trade shows how following the momentum indicators can assist in timing when the rally will draw to a close.
Below is the ultimate oscillator chart for the same time period. From point A to Point D the ultimate oscillator was flashing a very strong overbought indication. From there is was just a matter of watching for momentum to turn down to buy my spy put contracts.

Once the ultimate oscillator flashed extreme overbought I knew it was time to get ready to buy spy put contracts.
Picking When To Buy Means Don’t Second Guess
I received a lot of emails today as I was trying to post my spy put options trades today while doing them. A number of readers asked me how do I know to jump in when I see the overbought indicator. They explained that they remain nervous to buy fearing that the rally would move a lot higher.
The answer might seem pretty simple, but often simple works. When I posted the article about the waterfall pattern in the S&P which appeared this morning, I explained that the market direction for the day would be down. I could have been wrong, but from experience I have seen this pattern many times in the past and know the outcome.
I therefore have the conviction to buy my spy puts. When the moment arrives to buy the spy puts, there is no second guessing on my part. I step up and buy the spy put options. If I am wrong I have built up a cash cushion to help protect against losses. I also keep an eye on the movement of the S&P 500. If the S&P 500 should continue to climb after I have bought my spy put contracts I then reassess my purchase and decide whether to close it. Usually a loss of .25 cents is more than enough to tell me that I was wrong and I should close my spy put contracts, take the loss and wait for a clearer signal.
Confidence In Market Direction Is Key to Trading The Spy Put Options
Having confidence that my market direction outlook is correct, is all I need to step up to the plate as it were. Remember too that I have safe guards in place. I know how much loss I am willing to take. I know what timing indicators to watch in case I was wrong and I have already built up a cash cushion to help take some of the pressure from me to be right all the time.
I also am always buying when the ultimate oscillator indicates overbought and even if I am wrong in my timing of when to buy the spy put options, I have found that the overbought indicator normally will reflect a pullback at some point within a few minutes which if I am wrong will normally give me the opportunity to get out with only a slight loss.
Final Spy Put Trade Results
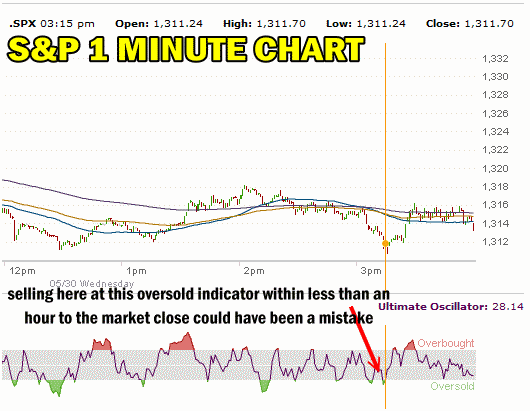
I sold my final spy put contracts a little over an hour later when the S&P 500 sold off again and made a new low for the day at 1310.76. What is interesting about this final ultimate oscillator chart is that while the ultimate oscillator did flash oversold, it was not much of a reading and certainly not extreme. This is often a warning that there could be more selling ahead but first there should be a bounce from the oversold reading. I posted on the options forum that I sold my contracts but that it could have been a mistake on my part as often the market will sell into the close after a day like today.

The ultimate oscillator flashed oversold, but it was not extreme and with less than an hour to the close, the market could have sold off lower into the close.
While I missed having Spy Put Options available at the start of the day since I did not buy any the day before near the close, I still was able to participate in today’s decline. This is what I prefer for my spy put trade. I would rather not hold spy put contracts overnight unless I am comfortable that the market will push lower on the next day. My spy put trades from today show that it is not necessary to always second guess the market the night before. Once the stock market is moving lower, I will have a chance to buy spy put contracts as there will always be a push back up during the day as that is the nature of stock markets.
The results today for my final spy put trade were quite good. I bought the spy put contracts with the spy at 132.24 for $3.29 and I sold them for $3.67 with the spy at 131.55. The return from the second trade was 11.5%.
View all the spy put 2012 trades
