Royal Bank Stock is one of the most widely held stocks in Canada. It is also a stock held by pension funds and institutional investors across much of the world, in particular North America, Europe and Asia. Royal Bank Stock is the largest of Canada’s big 6 banks. Royal Bank stock has a market cap of around $68 billion C$ and earnings of $18 billion C$. But like the other stocks in my series on Learn From The Bear, Royal Bank Stock has also seen its share of bear markets.
This is the third “novel” in my series on “Learn From The Bear”. This, the last article in this strategy series of studying past charts is in two parts as it is lengthy.
I picked Royal Bank Stock not only because I live in Canada, but because it has a very intriguing story in its charts and unlike many US and European Banks, Royal Bank was not leveraged into subprime markets, CDOs and other questionable financial products. It is an ultra conservative bank which stayed the course during the 2008 credit crisis and like all Canadian Banks, it continued to pay out its dividend. After 2009 the bank increased its dividend.
This year Royal Bank Stock has seen a 26% drop in its value. While perhaps shocking to some investors, it is only part of the great novel that is Royal Bank Stock and its history makes for terrific reading as you will find out in this article.
ROYAL BANK STOCK – What The Bear Markets Can Tell Investors
A Little History
Royal Bank of Canada first listed its stock on the Montreal Stock Exchange in 1893. In 1907 they were listed on the Toronto Stock Exchange. In 1920 Royal Bank of Canada became the largest Canadian bank with assets that totaled $594.7 million at that time. During the 1920’s and the 1930’s the bank had a number of losses and closed a number of branches but it did not fail to pay its dividend. In 1995 Royal Bank shares were listed on New York. For more history select this link about Royal Bank Stock.
As a sidenote I read this on the RBC website and thought I would share it. In the early years of the 20th century young bank clerks were prohibited to marry until their annual salary reached $1,000. This was because management feared that an early marriage would led to debt and because the banks transferred clerks to various branches which management felt made marriage a bad idea. Interesting isn’t.
I will begin the story of Royal Bank Stock in 1998.
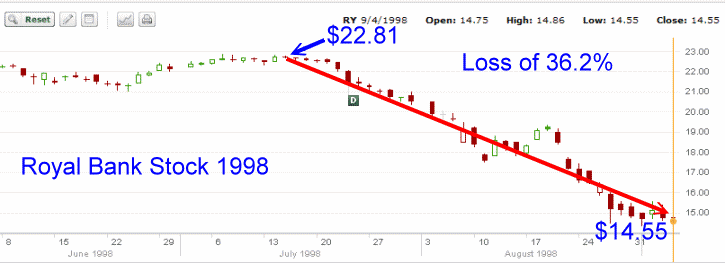
Royal Bank Stock – 1998: Loss 36.2%
In 1998 Royal Bank Stock fell 36.2% in a period of just over a month in one of its worst declines to that date and definitely one of its fastest. It was a stunning drop and placed Royal Bank Stock into a bear market. The loss was seen as substantial and many investors bailed out.
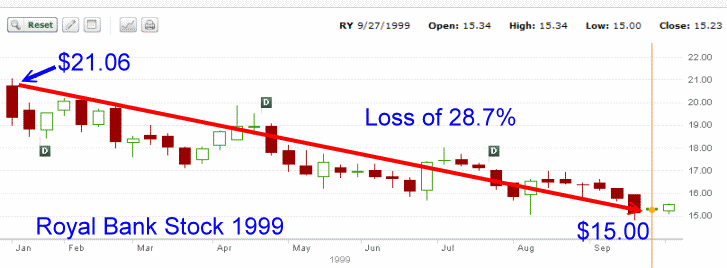
Royal Bank Stock – 1999: Loss 28.7%
The following year Royal Bank Stock recovered only to stage a repeat performance falling 28.7% over a period of 9 months. At $15.00 a lot of investors fled but looking back it was obviously a buying opportunity.
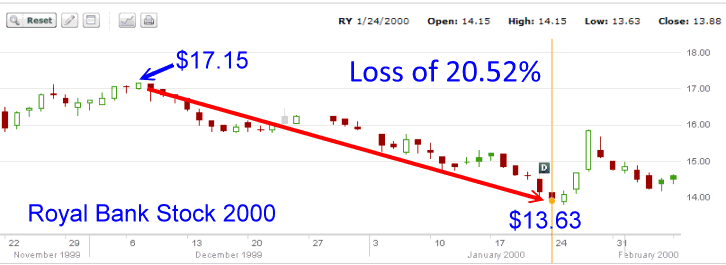
Royal Bank Stock – 2000: Loss 20.52%
The stock did not recover to the 1998 or 1999 highs but instead collapsed an extra 20.52%. While analysts felt that the bear market started in 2000, most stocks reflected a bear market environment by 1999. This third collapse in just two years took just slightly over 1 month.
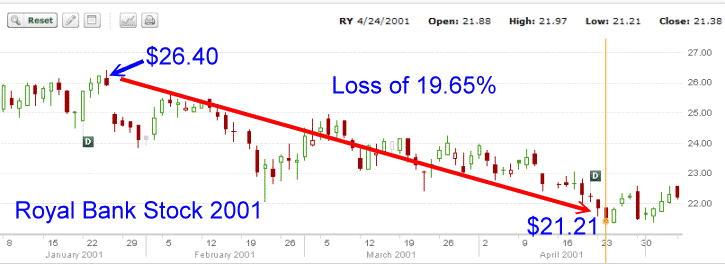
Royal Bank Stock – 2001: Loss 19.65%
For most of 2000 Royal Bank Stock recovered from the lows set early in the year. By January 2001 it had made a new high of $26.40 before it commenced a collapse of 19.65% over a period of 4 months.
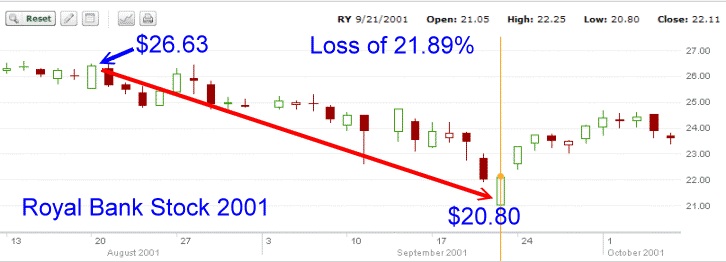
Royal Bank Stock – 2001 (second loss): Loss 21.89%
Following the devastating spring, the stock recovered and by August it was back to $26.63 before turning down and losing 21.89% in just two months.
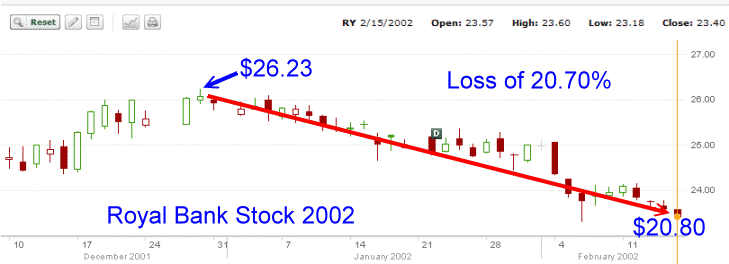
Royal Bank Stock – 2002: Loss 20.7%
By December 2001 the stock had staged a comeback only to collapse another 20.7% within 3 months. 2002 promised to be a difficult year for many investors. By this point, since 1998 it was obvious to those investors reading the story of Royal Bank Stock that losses in the order of 20% should be expected until the bear market actually ended. That meant when the stock sold off by 20% investors should be picking up the stock and then selling it as it recovered. Instead though many investors were buying at the higher levels and dumping the stock each time it fell, unaware that by reading the historic charts of Royal Bank Stock they should have realized that a collapse in the order of 20% should NOT be unexpected, but should be bought instead.
During this period I had a lot of investor friends who kept buying near the top and bailing as Royal Bank Stock collapsed. It was a shame as any investor who took time to read the history of Royal Bank Stock could tell that they should be doing the exact opposite.
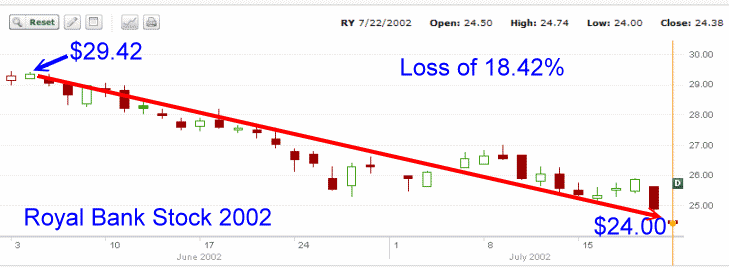
Royal Bank Stock – 2002 (second loss): Loss 18.42%
By June the stock had recovered only to collapse again in a month losing 18.42%.
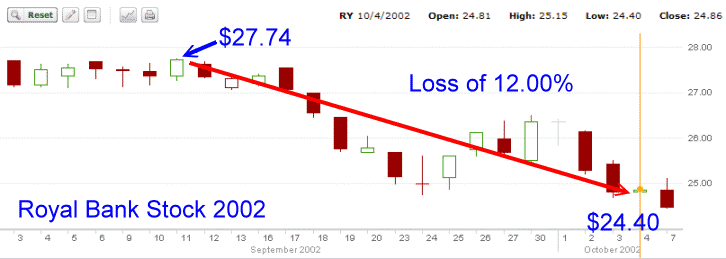
Royal Bank Stock – 2002 (third loss): Loss 12%
By September the stock had staged one more comeback although it failed to reach the old high. It fell another 12% into October.
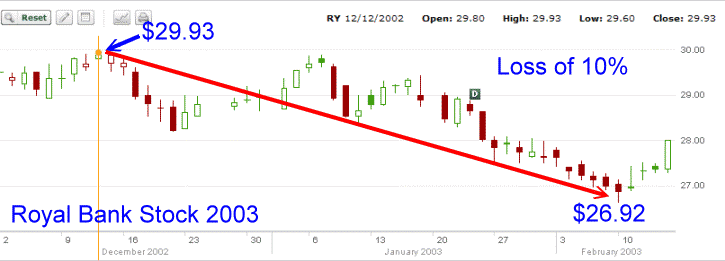
Royal Bank Stock – 2003: Loss 10%
By December 2002 Royal Bank Stock had fully recovered and began a 2 month decline for a loss of 10%
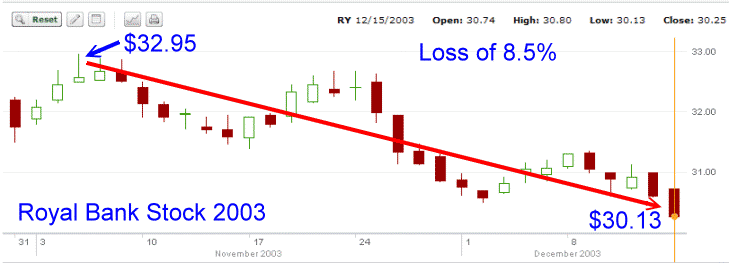
Royal Bank Stock – 2003 (second loss): Loss 8.5%
By November the stock had set a new high for the year and then pulled back just 8.5%, the smallest loss since 1998.
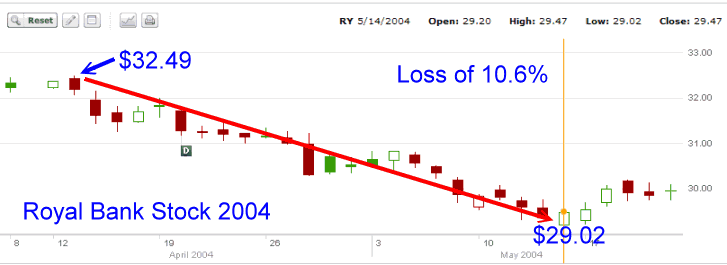
Royal Bank Stock – 2004: Loss 10.6%
The following year the bear market had ended but that Spring Royal Bank Stock fell 10.6% over a two month period.
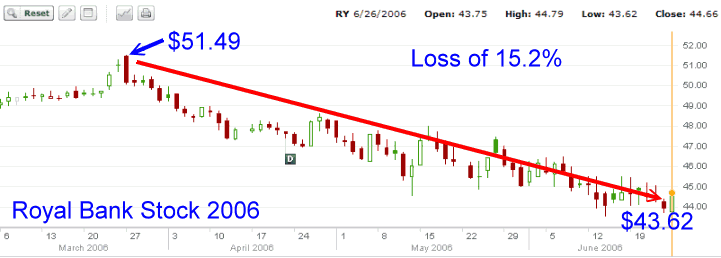
Royal Bank Stock – 2006: Loss 15.2%
After the loss in 2004 Royal Bank Stock rose throughout 2005 and into March of 2006 setting a new all time high at $51.49. From there the stock collapsed 15.2% over two months.
Royal Bank Stock – 2007: Loss 25.9%
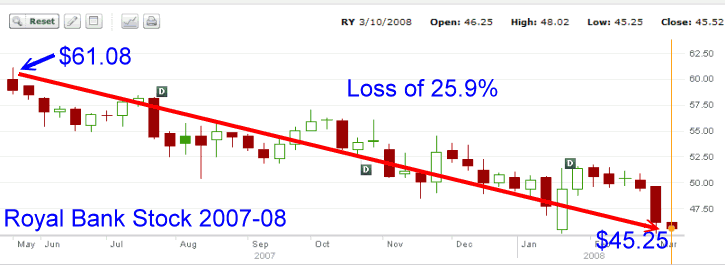
In 2007 a new bear market was underway. Royal Bank stock in May set another new all time high of $61.08 before collapsing a staggering 25.9% over the rest of the year into January 2008, a period of 8 months. The bear market was just getting underway.
As this article is quite long, this is a good place to end Part 1, right at the height of tension in our story on Royal Bank Stock. With the bear market of 2008 just starting to unfold, there are lots more hair-raising moments ahead.
Continue reading Royal Bank Stock Part 2


