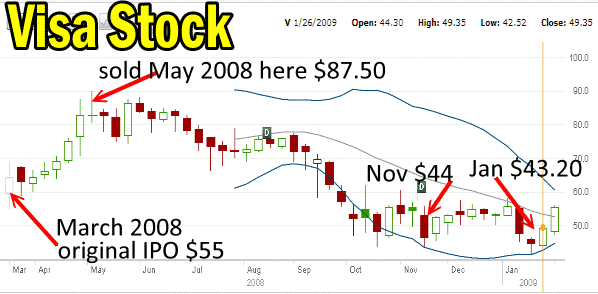
Visa Stock has been in my portfolio since March 2008 when it came to the market with its IPO. What a deal Visa Stock was at $55.00. I sold my original VISA Stock in May 2008 for $87.50. In November 2008 I tried to buy more but I was too low with my bids and did not get a fill. I kept trying to get a fill during December and then finally in January 2009, I picked up 1000 shares at $43.20. I had been bidding at $40.00 but Visa Stock just wouldn’t fall that low. I gave up at the end of December and moved to $42.50. In January 2009 when it sold off I jumped in too late but still picked it up for $43.20 which today looks like a great price, but in January 2009 I was sure it would fall below $40.00 before moving higher. Big mistake – should have bought more.
The chart below shows the early period in Visa Stock.
Visa Stock 2008 IPO to January 2009
You can see all the trades below. The problem was that when Visa Stock came out with its IPO there was so much demand that you were limited to the number of shares. I managed to pick up 300 shares on the initial IPO. That was the extent of my position. By May 2008 I felt Visa Stock had moved ahead of itself and sold for $87.50. It took most of the rest of 2008 for Visa Stock to fall back.
The bear market panic in the fall of 2008 pushed the stock below $45.00 but as explained, I was sure it would fall below $40.00. Anyway, you can see the action below and my entry in January 2009. The chart below is weekly, not daily. During the fall of 2008 I was heavily Put Selling Visa Stock but at put strikes that were too low. I was never assigned shares.

Visa Stock IPO to January 2009
The VISA Stock I bought in January 2009 I have yet to sell. Instead I have done covered calls and my cost basis is almost zero on the shares having earned almost $42.00 since January 2009 through selling covered calls. My VISA Stock goal is to sell my shares for $300.00 which I think I will see in my lifetime but being older that may not happen. If not, then my own children or grand kids should see that price point.
Meanwhile my Put Selling continues unabated in Visa Stock. The 1000 shares I own are set aside and not in my Visa Stock Put Selling trades. Any Put Selling that could result in being assigned shares would mean selling covered calls to be exercised out of those shares. Because of this I have kept the 1000 shares separate as I do not want to unload them at this time.
Visa is a terrific company and VISA Stock remains in my opinion undervalued. It will however take a lot more time to move above $200.00.
Visa Stock Chart Since IPO March 2008
Starting in January 2009, Visa Stock has been in a long-term uptrend.
It has set a pattern of higher lows and higher highs since the pullback in the fall of 2008 and winter of 2009. This is the type of trend Put Selling investors love to see. It makes Put Selling as an investment strategy profitable. It also means the risk of assignment of shares in VISA Stock is limited even though I may be Put Selling just slightly out of the money. This is because the uptrend keeps pushing VISA stock beyond my Put Selling strikes.
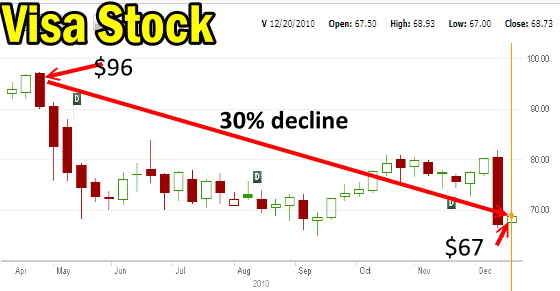
VISA Stock 2010 30% Collapse
It has not been all rosy though as in 2010 Visa Stock collapsed 30% over most of the year and Put Selling often ended with rolling puts lower or sideways but many times the put selling ended up with naked puts deep in the money.
The longer-term uptrend though has meant when my Put Selling resulted in naked puts falling into the money such as in 2010 they eventually ended up out of the money. The rolling strategy worked very well since the stock was generally in a longer-term uptrend despite the 30% collapse in 2010. This is why it is important to look beyond a few months and take a longer-term chart to see if there are signs that can establish the underlying longer-term trend.
Below is the collapse in Visa Stock from 2010. It fell from $96 to $67 over the course of much of the year. In December $67 marked the low and the stock has been in a solid uptrend ever since.

- Visa Stock collapsed 30% in 2010
VISA Stock Trades For December 31 2012
I have been Put Selling VISA Stock since 2008 and once again today.
I sold the $135 puts for Feb 16 options expiry for $1.42 and the January 19 2013 $140 for .76 cents.
I think half a percent for 3 weeks of work is fine for the January 19 $140 naked puts.
For February though I wanted at least 1% since this works out to about half a percent a month. I won’t be moving higher in Visa Stock until I see a new support level.
VISA Stock Support Levels
Presently there is support in the stock at $120. From $120 the stock shot up pretty quickly and has not taken a breather except at the $135 level. That breather though was short which tells me there is very little support in the stock until it falls back to the $120 level.
Learn More about VISA Stock
To learn more about trading within VISA Stock I have expanded on this article in the FullyInformed Members section to discuss a number of strategies to consider and how to watch for an end to this uptrend. This FullyInformed Members Article can be directly accessed through this link or Members can login here. Non-members can join here.
Visa Stock Internal Links
Review VISA Stock Trades For 2012
Review VISA Stock Trades For 2011
Review VISA Stock Trades For 2010
Review VISA Stock Trades For 2009
Visa Stock List Of Articles With Excerpts
Visa Stock List Of Members Only Articles


