Yesterday and today Microsoft stock performed well, but looking at the chart it is just a bounce from being so oversold a few trading sessions earlier. On Thursday Apr 12 I bought shares in the morning based on the market timing technical indicators, primarily the Ultimate Oscillator, which showed the stock had hit an interim bottom and was going to bounce. This in no way establishes a support level for Microsoft stock just a bounce.
It’s easy to tell when you look at the charting on the stock and realize as well that there are many analysts following Microsoft stock just now. This though is wonderful as the more analysts there are following the stock and talking it up, the more volatile it will be. For put selling or for those investors who love to buy and sell the options, this is truly wonderful for keeping option premiums elevated making dealing with Microsoft stock options quite profitable.
Microsoft Stock History Chart
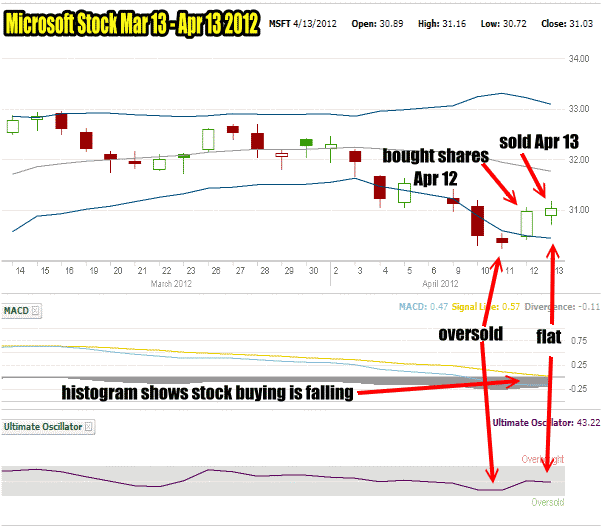
If I lay out the Microsoft stock history chart for the past little while you can see what both the Ultimate Oscillator are indicating and perhaps more interestingly the weekly MACD Histogram. (Moving Average Convergence / Divergence). The one month chart is below. By laying out the Ultimate Oscillator on MSFT Stock I can spot the oversold condition from three sessions ago. On Apr 11 the stock fell slightly but closed above the low of April 10. That is all it took for the stock to move up and yesterday I bought shares for a bounce trade.

Microsoft Stock History Chart for March 13 to Apr 13 2012 showing the MACD Histogram and Ultimate Oscillator
But today by the afternoon the Ultimate Oscillator showed that the stock was flat or basically no real conviction buying by investors. I sold my shares based of this. The one month MACD Histogram above shows that the stock remains under pressure and is still falling.
After my article yesterday on the MACD Histogram and how to use it, let’s take that same strategy and apply the 5 day MACD histogram to Microsoft stock and see what it is telling us. Should I have sold my shares or should I have held on over the weekend?
MSFT Stock Weekly MACD Histogram
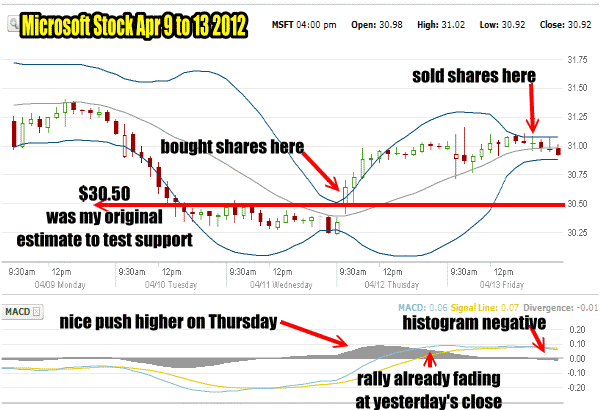
The past week is shown below and obviously there is no need to second guess the selling of my MSFT Shares. I had originally pegged $30.50 as the first level for a true test of some support in the recent run-up of Microsoft Stock. The stock fell through that support but kept pushing back up to it. This told me to get ready to do some buying of shares for a quick bounce. At the close on Wednesday you can see that the MACD Histogram was positive and showing buying interest. Based on what I know of MACD the histogram is telling me that the SHORT-TERM trend is up. That trend could last a day or two but not much longer, unless the monthly histogram improves and turns positive.

Microsoft Stock Chart with weekly MACD Histogram For April 9 - 13 2012
Recall last night’s MACD Histogram article. The monthly histogram shows the stock is under pressure and should fall further, but that is a longer term outlook. The weekly MACD Histogram is for short-term trading and it shows the stock is set for a bounce. Remembering that the Ultimate Oscillator confirmed the bounce in Microsoft Stock, I stepped in and bought stock Thursday morning as MACD Histogram rose. But look at how quickly that rise flattened out and then started to fall by the end of Thursday’s trading.
This tells me that unless the histogram can rise on Friday, then it is time to take my profit and sell my shares. Remember that I am holding lots of puts on Microsoft stock which I have sold and shares with covered calls for May.
On Friday the histogram continued to fall and then went flat. As it started to turn negative I sold my shares. I could be wrong and the rally might continue on Monday, but the one month histogram is solidly negative. Therefore until it turns positive on the monthly chart, any upside in Microsoft stock remains questionable. It still looks like Microsoft stock needs to fall back and continue to test for solid support which is probably somewhere between $28 to $30. Because of this, any further declines in MSFT stock should create additional put selling opportunities at the $28 or even $27 strike levels which would be a great entry point if Microsoft should fall that low going into May.

