

Yesterday we got the Weekly Initial Unemployment Insurance Claims and today the February jobs numbers. Both of these are interesting but neither are really game changers at this point. The Weekly Initial Unemployment Insurance Claims came in lower than expected moving down to 323,000 from 348,000. Recalling that 350,000 is the “magic” threshold where stocks seem to start having trouble, it was good to see the Weekly Initial Unemployment Insurance Claims move lower for last week.
Trading Based on Weekly Initial Unemployment Insurance Claims
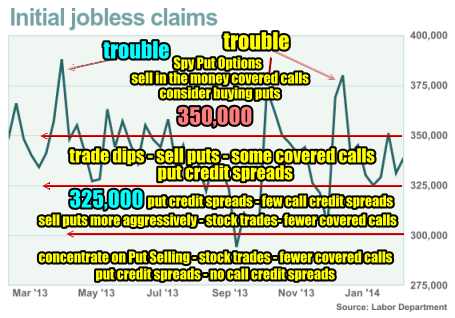
The numbers from Thursday are telling me as an investor that the “game” is still on. Using my chart from two weeks back, the 323,000 level places my trading between the 325,000 and 300,000 level. This means selling puts a bit more aggressively, doing a few (which means less) covered calls, looking at some stock trades and using put credit spreads rather than call credit spreads. This should be obvious to most options investors. If the general trend is up, then the last thing that interests me is selling call credit spreads as I have no interest in trying to roll call credit spreads higher to avoid owning shares. Put credit spreads work well when the general trend is higher. Yesterday I put in place two put credit spread trades which are on the members site.
Today’s Surprise – Unemployment Rate Up to 6.7%
While the unemployment number rose today for the month of February, I think Janet Yellen, Fed Chairman, say this coming. On March 5 she commented that the Fed has to do more to reach the goals for inflation around 2% and lower unemployment. In her swearing-in ceremony she indicated: “Too many Americans still can’t find a job or are forced to work part-time,” and continued to say “it is equally clear that the economy continues to operate considerably short of these objectives.”
The Fed Beige Book reported that the economy in most districts grew last month despite the harsh winter weather which has impacted everything from hiring and supply deliveries to customers getting out and shopping. In less than 2 weeks Yellen will chair the Federal Open Market Committee. At this meeting Yellen could announce a slowing of the tapering and personally I believe any rise in interest rates won’t happen this year at all but again that is a personal opinion with no evidence other than instinct, to back it up. As to the tapering being slowed, that is a tough call as the weather may have impacted the employment numbers more than anyone knows until it changes this Spring. If the employment numbers continue to improve there will be no reason for Yellen to slow the tapering so we may witness a “wait-and-see” approach in the next meeting.
Market Timing Signals Based On Unemployment
Personally I see nothing in the signals being generated by unemployment, either weekly or monthly, that advise me we are reaching a top in the markets. With March and April still being strong months among the best six months of the year, I believe we could see problems develop in May or especially the weaker summer months. This year though, with consumer spending lower due to the weather, we could actually see better spring numbers for spending as consumers return from winter hibernation. If that is the case then stocks may move higher in the spring months before a typical period of summer weakness.
All of this is purely conjecture. I am an investors first and not an economist. The signals on unemployment which I have used as a market timing system for decades, are not signaling a market top here so the “game” of trading the dips, looking for opportunities among big caps and keeping an eye on any rise over that 350,000 Weekly Initial Unemployment Insurance Claims threshold continues. Remember that 2013 was a terrific year. Almost any trade should have done well with the market steaming ahead. This year promises to be a return to a more normal market with volatility, choppiness and larger dips. Those are the three ingredients that can create significant returns. A good example is my market direction portfolio which is up 17% this year to March 7. Another good indicator I follow is the Spy Put Options Trades which this year are up 193%. That percentage might seem staggering, but it is because these are day trades done on the Spy Put Options using $10,000 base capital so returns naturally grow incredibly in percentage terms. But instead what I look at is the percentage gain against the entire portfolio. Last year for example the Spy Put Options supported a full 12% decline against my entire portfolio. I use the Spy Put Options to hedge my portfolio and spend the year building up a cash cushion to help in the event of a severe downturn. This year the Spy Put Options are ahead of prior years in terms of gains and support. This tells me that 2014 will have more volatility. That outlook is based purely on the growth of the Spy Put Options year after year. If by Feb or March there has not been a lot of growth in the Spy Put Options portfolio, then I know that volatility is running constant and usually low. The only other year since 2009 when the Spy Put Options were up as much as they have been this year, was 2010 which by the end of Feb 2010, was up 200%. 2010 was a volatile year and right now the Spy Put Options Portfolio is pointing to 2014 as joining 2010 for volatility.
Outlook Then Is…
To cut through to an outlook for trading, I see nothing that tells me the market is about to implode, plunge or collapse. There are no signals from the market timing system based on unemployment that I use, that shows any significant collapse is impending. Next week I will review the Weekly Initial Unemployment Insurance Claims once again for clues to any change in that outlook.
Internal Market Direction Links
Profiting From Understanding Market Direction (Articles Index)
Understanding Short-Term Signals
Market Direction Portfolio Ongoing Trades (Members only)