


Tue Apr 3 2018 Review
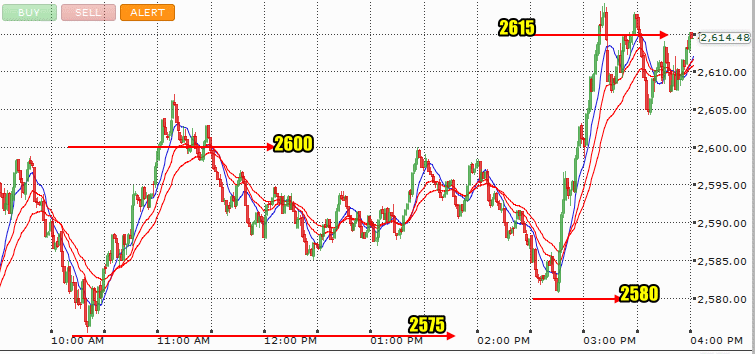
On Tuesday the S&P opened and immediately fell to almost reach 2575. The Feb 9 low was 2550 for this correction and while the outlook was for the index to fall this low, some buyers pushed back and by 11:00 they had broken through the 2600 level. That level failed to hold however and the index seemed to struggle. Volumes were lower as the afternoon progressed and the index began to slip shortly after 2:00 PM.
The S&P slipped from 2:00 PM but on light volume and by 2:30 as it fell back toward 2585 the futures changed and began to show strength was building. Volume picked up as it looked like a large number of buy orders were being executed. By 2:45 a second dip already saw increased volume and the market commenced a rally which sent it quickly over 2600 to close at 2614. So was this the test of the bottom of the correction or simply another bounce, this one off the 200 day moving average. Let’s see what the Market Breadth Indicators can tell us.
Stock Market Outlook review of Tue Apr 3 2018
Here are the market breadth indicator signals along with advance decline numbers from the S&P 500 Index and NASDAQ Index on Tue Apr 3 2018 and their outlook for stock markets for Wed Apr 4 2018.
Members should review the Market Breadth Indicators to be prepared for trading resumption on Wednesday as there are significant changes again in the Market Breadth Indicator numbers after Tuesday’s rally.
The market breadth indicator analysis and outlook is for FullyInformed Members.
Market Breadth Indicator – Advance Decline Numbers Outlook For Wed Apr 4 2018
Members can sign in to the full members site here
Become a member. Join here, read comments, review benefits
Market Breadth and Advance Decline Archive

Market Breadth Indicator – Advance Decline Numbers Outlook For Mon Mar 21 2022
Market Breadth Indicator – Advance Decline Numbers Outlook For Fri Mar 18 2022
Market Breadth Indicator – Advance Decline Numbers Outlook For Mon Mar 14 2022
Market Breadth Indicator – Advance Decline Numbers Outlook For Mon Mar 7 2022
Market Breadth Indicator – Advance Decline Numbers Outlook For Wed Mar 2 2022
Market Breadth Indicator – Advance Decline Numbers Outlook For Tue Mar 1 2022
Market Breadth Indicator – Advance Decline Numbers Outlook For Tue Feb 22 2022