


The S&P on Thursday fell lower and reached the 21 day moving average late morning shortly before noon. This brought in more buyers and the index spent the rest of the day climbing higher. The S&P reached 2998 around 3:00 PM and closed just below it at 2995. The index should open slightly above 3000 on Friday.
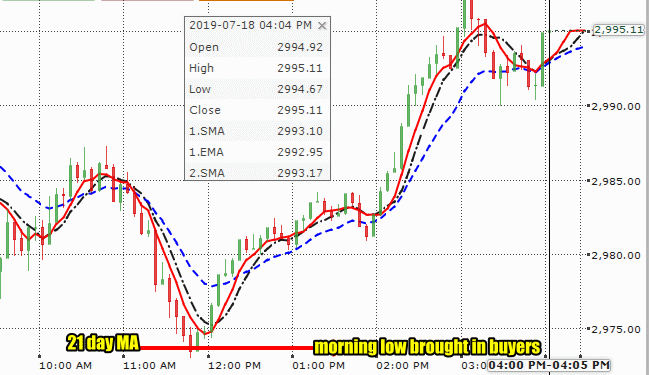
SPX 5 Minutes Intraday Chart for Jul 18 2019
Advance Decline Numbers Outlook for Fri Jul 19 2019
Here are the market breadth indicator signals along with advance decline numbers from the S&P 500 Index and NASDAQ Index from the close of trading on Wed Jul 17 2019.
Members should review the signals before trading resumes on Thursday.
As well there were a number of trades in the Market Direction Portfolio that were done on Thursday as outlined Wednesday night.
The market breadth indicator analysis and outlook is for FullyInformed Members.
Market Breadth Indicator – Advance Decline Numbers Outlook For Fri Jul 19 2019
Members can sign in to the full members site here
Become a member. Join here, read comments, review benefits
Market Breadth and Advance Decline Archive

Market Breadth Indicator – Advance Decline Numbers Outlook For Tue May 24 2022
Market Breadth Indicator – Advance Decline Numbers Outlook For Mon May 16 2022
Market Breadth Indicator – Advance Decline Numbers Outlook For Thu May 5 2022
Market Breadth Indicator – Advance Decline Numbers Outlook For Mon Apr 25 2022
Market Breadth Indicator – Advance Decline Numbers Outlook For Thu Apr 21 2022
Market Breadth Indicator – Advance Decline Numbers Outlook For Wed Apr 20 2022
Market Breadth Indicator – Advance Decline Numbers Outlook For Mon Apr 18 2022