In Part 1 of this Financial Investment article I discussed the two principal market timing tools I use to spot a collapsing stock. Those financial investment tools are MACD and Bollinger Bands. This, the second part looks at a variety of stocks to show how I use these financial investment tools to warn me in advance that a stock is having trouble.
Financial Investment Example 1: American International Group (AIG Stock)
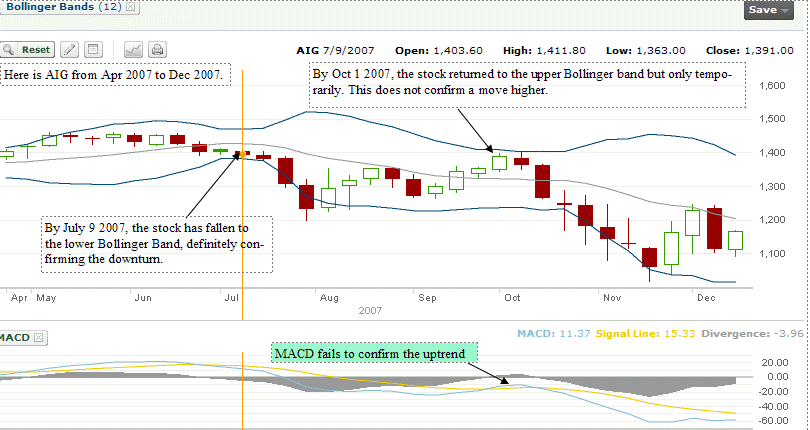
As a financial investment, some stocks have been total disasters. AIG Stock is one such example. Would these financial investment tools have worked to warn about the collapse in AIG Stock? It is without a doubt among the worst stocks I can remember. AIG stock value has been adjusted by the charting software to reflect the horrible consolidation of July 1 2009 of 1 share for every 20 shares held. The loss on AIG for shareholders can only be described by one word – shocking. Select this financial investment AIG Stock link to view the devastation in valuations.
But the financial investment tool, Bollinger Band warned back on July 9 2007 that the stock was in a downtrend. Then in September when the stock moved to the upper Bollinger Band, MACD failed to confirm any move higher. While nothing is perfect, these simple tools told investors to stay away from AIG and as such those of us who sell naked puts should consider a different stock, or consider selling naked calls if that is their interest.

Financial Investment Tools warned investors to leave AIG early in its decline.
Financial Investment Example 2: Kraft Foods Inc. (KFT Stock)
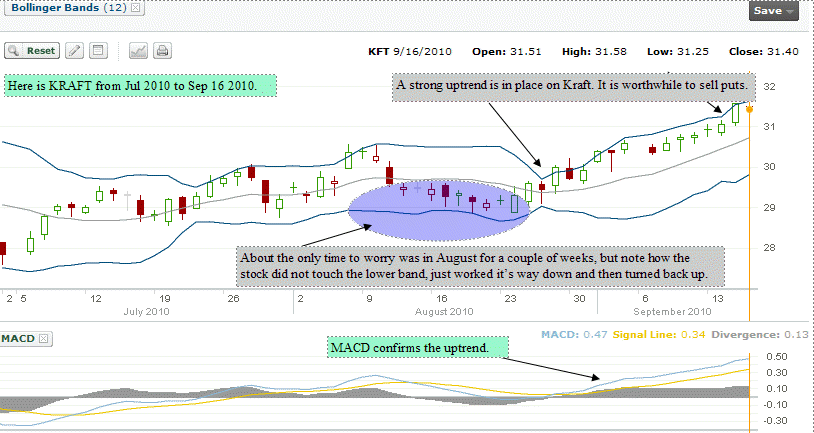
In our second financial investment example I will look at Kraft Stock . The chart below shows the period from Jul to September 2010. One of the important aspects of using these two financial investment tools is to confirm stocks in uptrends. Stocks in uptrends make good candidates for put selling. With Kraft Stock the uptrend is quite clear and confirmed by the financial investment tool, MACD. As well the only time in the past 3 months to actually worry was during a couple of weeks in August, however the stock did not actually follow along the lower Bollinger band or ever close on it. Kraft stock is definitely in an uptrend at this time (Sep 16 2010) and the two financial investment tools, MACD and Bollinger Bands confirmed it. This makes put selling against Kraft Stock very easy.

Keeping these financial investment tools always available can help to confirm stocks in uptrend.
Financial Investment Example 3: General Electric (GE Stock)
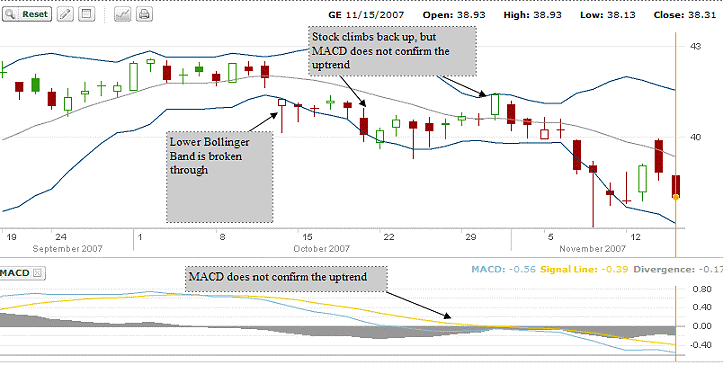
My third financial investment strategy is General Electric. The chart below shows GE Stock from Sept 2007 to Nov 2007. You can see that the Bollinger Band warned to get out of the stock by Oct 15 2007 and MACD confirmed this call as the trend definitely points down. At that point an investor would close out. The stock then rebounded but MACD failed to confirm any uptrend. By following these two financial investment indicators, an investor would have been out of GE in mid October 2007 long before the real damage commenced.

The financial investment tool, Bollinger Bands warned investors on Oct 15 2007 to leave GE Stock
Financial Investment Example 4: Canadian Imperial Bank Of Commerce (CM Stock)
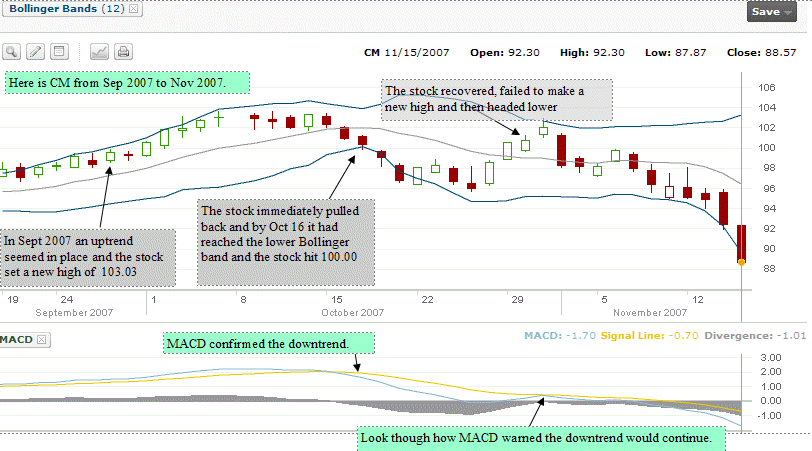
My fourth financial investment example is Canadian Imperial Bank of Commerce, stock symbol CM. In September 2007 CM Stock marked an all time high of 103.03. The chart below shows that within a month both the Bollinger Bands and MACD warned the stock was going to turn down. Now 3 years later the stock has still not recovered to its high.
In the chart you can see how on Oct 16th the Bollinger Bands and MACD warned about a downturn. When the stock started to recover later in October 2007, but failed to make a new high, MACD never confirmed the uptrend but indicated that the downtrend would continue. This left plenty of time for investors to get out of CM stock before it collapsed.

Both financial investment tools, MACD and Bollinger Bands gave investors plenty of warning to get out the stock before it turned a lot lower.
Financial Investment Example 5: Manulife Financial (MFC Stock)
One last stock worth looking at is Manulife Financial. For my fellow Canadian investors, Manulife has been a disaster for more than 3 years. There is just no other word for Manulife for long-term investors. But for option traders and day traders it has been a good stock as the volatility and stock price swings have made for good option prices and great returns.
The chart below shows Manulife for the months June to September 2010. The stock has moved back into another major downturn. Look at the financial investment tool, MACD. While recently the stock has twice moved up, MACD does not confirm it as it remains below 0.
Not until MACD moves firmly above 0 will the stock be in an uptrend. That doesn’t mean the stock cannot be traded or naked puts or naked calls sold, but it is a warning to be careful. This stock could fall further.

The financial investment tool MACD warned that Manulife Financial was in trouble long before it turned substantially lower.
Financial Investment Article Summary
Early Warning Tools To Spot A Collapsing Stock
There are lots of other financial investment technical tools an investor could consider using. This is an example of the two principal financial investment tools I use in helping to know when I should be more careful when selling naked puts or naked calls.
MACD and Bollinger Bands are tools that are not really meant for a strategy of what strikes to select or how far out in time or out of the money to consider when selling naked puts, although I am sure an investor could develop a strategy based around these technicals. As well I am sure an investor could develop a strategy for buy and selling stocks based on using both financial investment tools.
Instead I use them to help me spot a collapsing stock to protect from portfolio from losses. I do know that these tools have saved me many times from selling naked puts on a stock that I thought was strong, only to find out that the stock was getting ready for a major pullback.
Remember, like all financial investment strategies, nothing is foolproof and there are never guarantees that something that worked once will work again. But for me these financial investment tools have provided me with great clues about when to sell my naked puts or naked calls and when to walk away.
Return to Part 1 of Financial Investment Tools To Spot A Collapsing Stock.

