Exxon Mobil Stock remains highly volatile and as such keeps popping back up in my portfolio. Today (Nov 1) I took advantage of the volatility in oil and sold two sets of put contracts on Exxon Mobil stock. Exxon Mobil stock on October 4 2011 hit an intraday low of $69.21 and by Oct 27 it had risen to $82.20 before closing at $81.88. This is a move of 18.7% in Exxon Mobil stock.
That move more than beat the move by all three indices including the NASDAQ which saw a move of over 17% in the October run-up in stock prices. Yesterday’s weakness gave me the opportunity to sell puts against Exxon Mobil Stock.
I had looked at the charts prior to yesterday in determining what strikes to sell when there would be some selling. Let’s have a look at the latest Exxon Mobil Stock chart.
Exxon Mobil Stock Chart – Determining Strike Puts To Sell
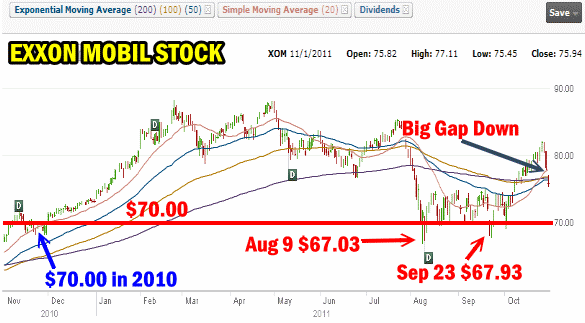
This morning saw a big gap down and with the spike in the VIX Index Exxon Mobil Stock put premiums climbed dramatically. Decided what strike to sell was pretty easy. The $70 strike is still my put strike of choice. On Aug 9 the stock set a new low for the year at $67.03 and on September 23 Exxon Mobil Stock came close to that low with a move to $67.93.
Exxon Mobil Stock $67.50 Put Is Poor BUT….
Put premiums at the $67.50 strike are poor but if an investor was worried it would be a strike to consider since yesterday the $67.50 put was yielding around half a percent which still yields 6% annually and provides a huge downside cushion in Exxon Mobil Stock. Not a bad way to beat bonds and treasuries with a lot of protection.

Exxon Mobil Stock Chart for November 1 2011
Exxon Mobil Stock – The $70 Put Strike Is Prime
The $70.00 put strike has a lot of support. In late 2010 the stock had pushed into the $70.00 level and stayed there for all of November until Mid-December. From there the stock moved higher and became I believe over-valued. In the recent bear market Exxon Mobil stock has traded between $70.00 and $75.00 making selling puts simple. However in October when investors felt that Europe would solve its crisis, the price of oil climbed back above $90.00 pushing Exxon to above $80.00 and back into over-valued territory.
Once the price of oil moves above $100.00 and stays above $100.00, then Exxon Mobil Stock will be fairly valued at $80.00 but presently any move above $80.00 is definitely suspect.
EXXON MOBIL STOCK – Having A Plan In The Event Of A Larger Pullback
The important thing about selling puts on any stock is having a plan in place BEFORE selling the original set of puts. Exxon Mobil Stock is no different. By having a plan in place there is no emotion to the trade. If the trade moves the wrong way I don’t need to try to figure out my next move as I already know the next move in advance.
If Exxon Mobil Stock fell below the recent low of $67.50 before my $70.00 puts expired the question would be where to roll down to with my puts. This would mean buying back my sold puts and selling new puts.
EXXON MOBIL STOCK 5 YEAR CHART
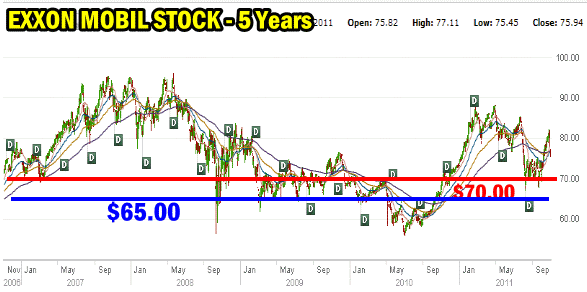
The five-year chart in Exxon Mobil Stock holds the key to what to do in the event of a severe correction. Looking at the chart below I can see that $70.00 (red line) is a very good strike to consider, however in the bear market of 2008 when the price of oil was lower than today, it I remove the spike downs, $65.00 is a pretty strong strike level.
This means if Exxon Mobil Stock falls to below the Aug 9 low of $69.03 I could consider rolling, first to $67.50 and then to $65.00. However looking at the 5 year chart, I would be pretty comfortable buying back my $70.00 strike puts and simply rolling them out further in time at the same strike. The chance of Exxon Mobil Stock recovering back to the $70.00 strike is quite high making the decision to stay at $70 and roll sideways a good choice.

Exxon Mobil Stock 5 Year Chart reviews where to roll in the event of a major pull-back.
Exxon Mobil Stock – It’s Great Having A Plan Of Action
Planning solves a lot of issues when it comes to investing. With the above plan I have three choices I can make in the event of a severe correction that I may not have expected. But with a plan in place I no longer have to worry about the outcome as I already know my decisions in advance.
With the above knowledge then, I waited until today and sold 10 Exxon Mobil Stock put contracts for 19NOV11 $70.00 for .71 cents and 5 Exxon Mobil Stock Put contracts for 17DEC11 $70.00 for $1.38.
Select this Exxon Mobil Stock link to see the latest XOM Stock quote.
Select this Exxon Mobil Stock link to see the trades for 2011.

