

In recent comments by Jim Cramer he mentioned two stocks that I follow and which he didn’t like ahead of the jobs numbers on Friday. Here’s what Cramer said. “What’s the point of owning Colgate-Palmolive , which has a little yield? What’s the point of sticking with Clorox, which doesn’t have a huge up year going for it?” Personally I have to disagree. It comes down to your strategy and what you are expecting to earn from the trade in Colgate-Palmolive Stock and Clorox Stock. It also comes down to risk of capital.
Clorox Stock Trades Returned 30% in 2013
To date in 2013, Clorox Stock has returned 30%. While Clorox Stock does look fully valued, there is a lot of protection for my capital in continuing to generate income through Put Selling. What sets Clorox Stock apart for investors such as myself is the ease with which Put Selling can be done and the higher level of safety in the trades themselves for the capital I have at risk.
Put Selling The Trading Patterns
With Clorox Stock one of the key components to the success this year has been trading the chart patterns of the stock. In fact, that has been the key component for the past 5 years. In 2009 the stock was trading between $50 to $61. The trading pattern made it simple to trade and the returns for the year while not staggering were still 17%. Not bad considering how easy the trading was.
Before The Great Bear
That ease though stretched back long before the great bear of 2008 to 2009. The chart below shows the principal put strikes I was selling over the years from 2004 to 2009. Even the bear collapse only saw the stock fall to $45.71 and as you can see from the volume there were a lot of sellers in the bear market. This was such a shame, because the company was solid throughout the great recession and indeed while people were dumping shares of all stocks in that bear market, I was picking up Put Selling premiums that can only happen in a bear market.
The chart below though shows two important aspects of investing through Put Selling, or actually investing of any kind.
First Key – Chart Trading Pattern
The first is that there is a trading pattern evident that can be readily traded by an investor who wants to take the time to look at the chart. Just looking at the chart you can immediately get a grasp for where to consider selling puts, where to buy stock and where to sell it when the stock moves higher.
Second Key – Recovery and Rescue
The second key aspect which the chart shows is that this stock recovers. That adds a huge degree of safety and means that this stock will respond to a variety of rescue strategies, including the most simple of all, averaging down.
On May 2 2007 Clorox Stock reached an Intraday high of $69.36. It never saw that high again until four years later in 2011. Yet any investor who bought stock or sold puts in May 2007 near the high would never have had to worry and could have averaged down even through the bear market. The reason for this high level of comfort is knowing from the chart pattern that Clorox Stock will recover. That in itself makes a stock worth trading in especially when the principal method of investing is selling puts. If I sell puts on Clorox Stock and the stock should pull back dramatically and leave my puts in the money and eventually I am assigned, I would never worry. Instead I would apply the most simple rescue strategy of selling puts deeper out of the money to either be assigned much lower which would bring my cost basis lower or if not assigned, then to earn additional capital which again lowers my cost basis in the stock. Not all stocks are created equal and therefore this type of recovery strategy will not work with all stocks. This is why I have traded through Put Selling in Clorox Stock since 2004.
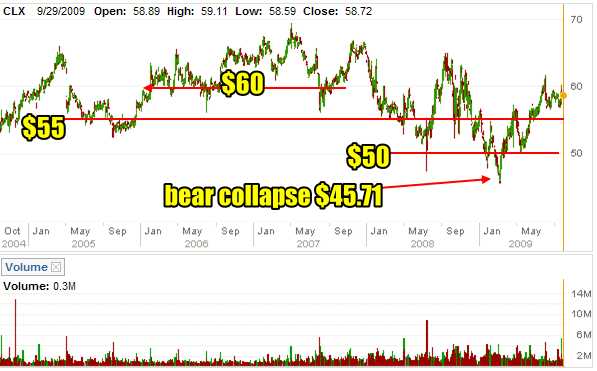
Clorox Stock from 2004 to 2009
Understanding Averaging Down
Dennis Gartman, famed author of the Gartman newsletter, commented that the worst mistake an investor can make is averaging down on a stock. He always advises that if a stock is falling or a trade is not working get out quickly. He tells his readers that when a stock moves higher, that’s the time to average in or average up. If a trade is working he believes an investor should buy more.
I remember in January 2008 I attended the Toronto Financial Forum in which Gartman spoke. I remember him telling the audience that America was in a recession and he was short Google and Research in Motion Stocks. He was long Gold, Agriculture Commodities and Bank Stocks. Gartman has mentioned a number of times that top traders, such as himself, will be wrong 60 to 80 percent of the time or more.
This is also the basis of Vector Vest. Dr. Bard DiLiddo uses a momentum approach to tells investors when to buy stocks. His momentum indicators then tell him when to sell those stocks as momentum turns.
Put Selling though is a bit different. I sell puts on stocks that are either in a trading pattern or moving higher. I sell on dips or earnings disappointment but overall I am selling momentum to the upside by selling the downside. If a stock is moving higher there is nothing better than selling puts when it takes a dip. Sometimes though that dip ends up being the end of the uptrend but investors just don’t know it at first. This means sometimes my naked puts can end up in the money and at risk of assignment.
Clorox Stock Stands Out
This is why I tend to gravitate to stocks like Clorox which have an underlying strength. They are held by large institutional investors who rarely trade them but instead earn the growing dividends and some day will unload them for what they hope are enormous profits after years of keeping them in “their vaults”. In my case I sell puts and will own stock for short periods if assigned, but I prefer to be selling puts for income in a stock that has a high degree of comfort. Clorox meets that need. Therefore if I ever get caught such as in the bear market of 2008 to 2009, I have no fear is continuing to sell puts at lower valuations in an effort to bring down my overall cost. I am basically averaging down in a stock and working my valuation to the point where I can sell calls to be exercised out, or in a lot of cases simply unload the stock. But I want profits all the way along, not losses. I have found only those stocks with strong recovery patterns make the best consistent winners for put selling.
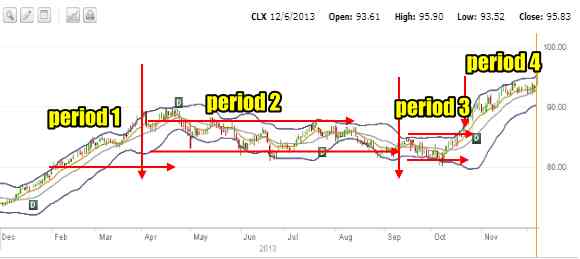
Clorox Stock 4 Periods of Profits
In 2013 for example the chart below shows the trading pattern I have used. There have been four trading periods or patterns for this year so far.
Period 1: The first period was from January 2 to April 2 when the stock moved from $74 to $89. This was a strong uptrend that made Put Selling easy. It was a matter of following the stock higher and continuing to sell puts slightly out of the money, by staying 1 strike below where the stock was trading.
Period 2: The second period started in April and ran until September. During this period the stock drifted sideways but stayed above $81 on the low side and just above $86 on the high side. Again Put Selling was very easy simply by selling puts on dips and there were a lot of dips.
Period 3: The third period started in September and ended in late October with the stock gaining momentum and pushing back up to $90 by the end of October. This made Put Selling again fairly easy by stay out of the money but there was only one major dip.
Period 4: This is the present period. Clorox stock has pushed into unknown territory here. It reached a number of new all-time highs including Friday’s all time high of $95.90. This rising pattern into unknown valuations has actually not been that hard for Put Selling. I am presently holding the $90 put strike which is at the low end of the present trading range.
30% Return Based On Stock Patterns
By studying the chart patterns of many stocks you can begin to see the opportunities for profit and income. It does not matter what your method of trading is. I do Put Selling while others like buy and selling of stocks. Still others prefer all covered calls. Then there are those who like more complex option strategies. All of these methods of investing will benefit by taking the time to understand the stock pattern being persented. When an investor understands that stock assets are primarily driven by emotion, you can then understand why chart patterns make sense. They are presenting a picture of how investors have reacted and how their perceive a stock.
Looking Forward With Clorox Stock
Eventually the trading pattern for a stock may change and Clorox stock is no different. One day this stock will no longer be in my portfolio. Even at present the book value is only $1.12, debt to capital is 96.81% and the dividend payout ratio is at 59.34% as Clorox Stock pays out the highest dividend yield of all stocks in the household products industrial sector. While those figures may concern some investors they do not concern my strategy.
Revenue is decent and the growth continues for the company. Until that turns down I will continue to be Put Selling this stock. For 2014 I am not sure how much higher the stock can rise. I will though be watching for the next pattern to emerge or whether the present pattern will continue for months to come.
Presently though I like the $90 and $87.50 put strikes and those are the present valuations I will be Put Selling in. I do know that to earn 30% again next year will all depend on the chart pattern that develops and as I am not anticipating a big change in Clorox Stock’s trading pattern for 2014 I am expecting another great year for put selling returns.
Clorox Stock Internal Links
Review Clorox Stock Trades For 2013
Review Clorox Stock Trades For 2012
Review Clorox Stock Trades For 2011
Review Clorox Stock Trades For 2010
Review Clorox Stock Trades for 2009
Review Clorox Stock Articles Index
Review All Clorox Stock Strategy Articles
Review All Clorox Stock In-depth Strategies (Members Only)
Clorox Stock External Links
Clorox Stock Investor Relations
Clorox Stock Splits & Dividend Info