I have been Put Selling against AT&T Stock since 2011. The stock remains a star performer for Put Selling. On May 28 2013 AT&T Stock took a big hit and fell from an intraday high of $37.15 to close at $36.18 a pull back of 2.6%. I had previously sold 2 sets of naked puts on AT&T Stock at the $36 put strike. Within 4 trading days AT&T Stock had fallen to an intraday low of $34.58 before closing on June 3 back at $35.07. This intraday low represented a drop of 3.9% from my $36 put and placed by $36 puts deep in the money.
On May 31 I rolled down half of the $36 naked puts to July at $35 and sold 5 additional naked puts for July at $35 because the put premiums were excellent. The following trading day however AT&T Stock fell further and I could have earned considerably more as the July $35 puts moved up almost 35% more as AT&T Stock fell below $35. Instead I sold more $35 put strikes for June 22 options expiry as the technical indicators showed that the collapse below $35 was unwarranted and should bounce back.
AT&T Stock Technical Indicators
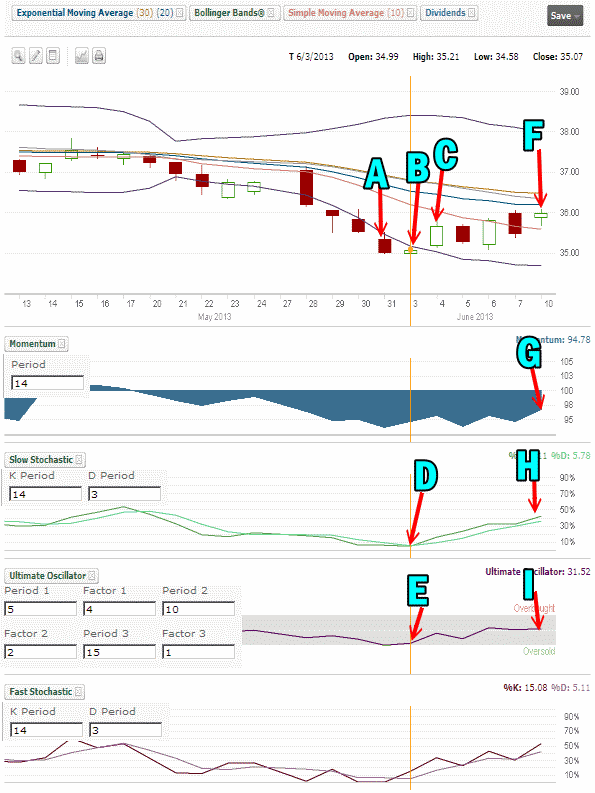
If we look at the past one month and include the four main technical indicators I have used for my AT&T Stock trades you can understand better my trading and my outlook. I have marked the key aspects on the one month daily chart below.
A. On May 31 with AT&T Stock falling through the Lower Bollinger Band I bought back my first set of $36 June 22 put options which comprised 10 contracts. It cost me .75 cents per contract to buy to close. I then waited a bit during the day and AT&T Stock fell lower and I sold the July options expiry at the $35 strike for $1.25. Instead of selling 10 puts though I increased the quantity to 15 put contracts on AT&T Stock.
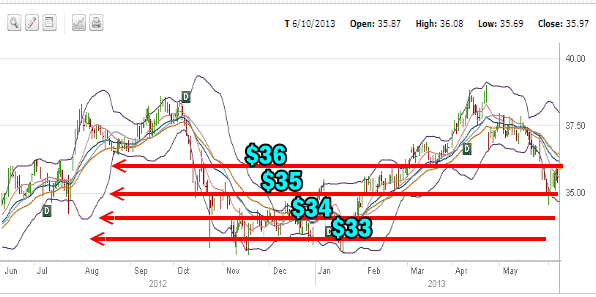
B. The following day AT&T Stock fell further at the open and eventually during the morning AT&T Stock fell below $35 to $34.58 and I sold the June 22 naked puts at the $35 strike for $1.01. I did just 5 naked puts which brought my total number of naked puts at $35 to 20 or 2000 shares. The strategy is if AT&T Stock continues lower I will roll down half of the position or 10 naked puts to $34 into August. This will leave me then with 10 naked puts at $36, 10 at $35 and 10 at $34. My average cost WITHOUT using any of the earned premiums from the naked puts would be $35 on all 3000 shares should AT&T stock collapse below $34 and I was assigned on all 30 naked put positions. $35 is excellent support in AT&T Stock as you can see in the second image further down in this article. This is why I picked the strategy I was using and would have been happy owning 3000 shares of AT&T Stock at an average price of $35 should that have happened.
C. At the end of the day on June 3 (B) AT&T Stock actually closed above its open. The next day Point C, was June 4 and AT&T Stock opened above the June 3 close and I bought 1000 shares and announced the buy on twitter and my yahoo forum. This was to take advantage of an anticipated rise in AT&T Stock for a short-term gain.
D. The reason I bought shares is because all the indicators pointed to a bounce back in AT&T Stock. D is the slow stochastic and as you can see it indicated extremely oversold on June 3.
E. The Ultimate Oscillator also indicated extremely oversold on June 3. Also the Fast Stochastic was already turning back up on June 3. I have the fast stochastic in the chart below although I missed adding a key letter to it. You can see though that the fast stochastic was already turning up.
F. This is today’s action (June 10) as of around 1:30 in the afternoon. AT&T Stock recovered to above $36 and I have sold my stock which I purchased on June 4.
G. Momentum remains quite negative on AT&T Stock despite the rally back to just above $36. This is part of the reason I sold my AT&T Stock rather than wait to see if it can get above $36.50.
H. The Slow Stochastic though is still showing AT&T Stock should move up as of this morning (June 10).
I. However the Ultimate Oscillator is flat and has been flat for the past 3 trading days despite AT&T Stock pushing higher.

AT&T Stock Technical Indicators In Use
Emails From Investors
By June 3 my inbox was flooded with worried emails from investors wondering what they could do as they had sold the same AT&T Stock put strike at $36 and were now sitting with in the money naked puts. Most had sold the $36 put strike, confident AT&T Stock would hold above $36. Once it fell, none seemed to have a plan in place and few had even looked at the AT&T Stock one year chart to determine whether the $36 naked put strike made much sense for them to be Put Selling.
Having patience with a stock is essential as is having confidence that if assigned shares you can work your position to keep it profitable until the shares are exercised away.
Consider The Strategy in Use When Put Selling
When I sell naked puts I only sell them on stocks that I know I can eventually work back into a profitable position if they become unprofitable. Much of my profits come from having confidence in the stocks that I sell puts against. When they pull back I do not need to panic and close for losses. Instead I am happy to set up a new pattern such as I have done now with AT&T stock. Should the stock fall below $35 I will end up holding 10 naked puts each at the $36, $36 and $34 put strikes. As soon as I saw AT&T Stock pulling back I knew that I needed to set up another trade pattern. It did not have to happen overnight, but I knew that simply keeping all my naked puts at $36 might still work out, but it was better to hedge the possibility that the $36 puts may end up by June 22, in the money and at risk of assignment. To start off that strategy then I simply rolled half of my $36 naked puts down to $35. I am then ready to roll half of the $35 naked puts down to $34 if AT&T Stock should continue to fall below $35.
If I ended up holding all three strikes (34, 35 and 36), I know I can either roll out and stay at the same strikes for more income, or roll each one lower again, from 36, 35, 34 down to 35, 34, 33.
Why Buy Stock?
Buying AT&T Stock for a quick bounce back is simply taking opportunity of what I saw at the time, namely a bounce coming in the stock. Even if the bounce had only taken the stock to $35.50, it would still have added to my profits.
Understanding Your Stock
When AT&T Stock pulled back it really is not of a concern if you have done the homework up front and know what the stock is capable of. For example, if you look at the AT&T Stock chart for the past one year you can see that the put strikes I am mentioning all have a degree of support with very good support back at $34. You can understand then that when I sold naked puts at $36 I already had the AT&T Stock chart below in my notes and knew that if AT&T Stock fell back, the strategy would have to be adjusted to take into account support levels at $34 and $35.

Reviewing a stock chart, particularly a one year chart, can give strong evidence as to a possible outcome to a trade. While I liked the $36 put strike you can see that $36 had better support last summer than it does now. Nonetheless, $36 has enough support that I felt it was a credible put strike to sell, but I also knew what I would have to do should $36 fail to hold.
Summary of AT&T Stock Put Selling
To sum up then, you can see that by having the plan already in place prior to even starting the trade, an investor can protect themselves from panic simply because they know in advance what needs to be done should the trade turn against him. In my case I plan to keep the $36 naked puts even if they end up in the money by June 22 and I will roll them out at the same strike. When you look at the one year AT&T Stock chart above you can see that $36 has been reached many times by AT&T Stock. I am sure some time over the next 12 months the $36 strike will once again end up out of the money, but until then, I am happy to just keep rolling the $36 naked put each time it is in the money, to keep bringing in more income.
Should I be assigned shares at $36, not only will I earn the dividend, but I will also sell covered calls at $36 and eventually I believe I will be exercised back out. You can clearly see that the two keys to successful investing are patience and confidence. Without both, many trades will often end with losses. In my case though I have the patience to wait it out and the confidence to keep Put Selling as I believe the trade will continue to generate significant profits and income in AT&T Stock.
T Stock (AT&T Stock) Internal Links
Review T Stock Trades For 2013
Review T Stock Trades For 2012
Review T Stock Trades For 2011
Review T Stock Strategy Articles
Review Members Only T Stock Strategy Articles

