I hope you find the information,
concepts, ideas and strategies on my site of value. If you would like to assist me with
the maintenance costs, and time spent keeping my site updated, I
have set up a Paypal account for those who would like to donate.
Thank you in advance. Remember, nothing on my site is financial
advice or recommendations. Investing is risky and losses can be
large. Trade at your own risk.
Read The Disclaimer
By using this site,
you agree to be bound by its terms of use.
The full terms of
use can be read here.
If you do not agree to the terms of use, do not access or use
this site.
Nothing presented is financial advice, trading advice or
recommendations. Everything presented is the author's ideas
only. The author accepts no liability for its use including
errors and omissions. You alone are solely responsible for your
own investing and trading. There are considerable risks involved
in implementing any investment strategies and losses can be
large. Trade at your own risk.
Feb 12
2010 / Strategy Discussion
USING THE
SPY FOR HEDGING DURING MARKET DOWNTURNS:
HEDGING STRATEGY 1:
WHEN
I CAN WATCH
THE MARKET THROUGHOUT THE DAY
In a market downturn I
like the SPY puts. For me the biggest reason besides having
used them for years, is because they have good premium
and as they follow the S&P accurately, premiums are always
decent and reasonable. In a downturn, volatility will force
up the premiums. I always try to buy 2 months out and slightly in
the money.
Some of my friends
tell me that Powershares (QQQQ) are better and cheaper. I
have not used them, but if you have experience with them,
you could contact me with some
of your results and I would be pleased to share them with
other readers of my site. The Ultra shorts are not my choice
and I have never used them on the S&P. The problem with the Ultra Shorts
I have found from back testing, is that when
the market moves against me, losses can be large. Unless I get out
quickly I can be
looking at larger losses than the puts, not always I
suppose, but certainly when I have studied the Ultra Shorts,
it does appear to me that the puts are better to hold. It's
my choice, but definitely by volume, I can tell I am in
the minority. The Ultra Shorts are very popular.
Buying puts is tough for
a lot of people as it is going against how we are taught about investing. We are all fed the story of
stocks moving higher. Why then buy puts? Simply because the
market trend at times is down and not up. When this happens
I have to decide if I have faith in the market
call. When I buy a put and the market moves higher, which
often happens, I am looking at a loss. I have to
decide if I can stand the loss. To learn my strategy I spent
two years paper
trading. This meant checking past market calls, plotting the
moving averages and seeing
how often when the averages indicated that the market was
turning down, the market
did indeed move lower. It's a question of building my confidence
in my ability to read the market signs and believe in my
purchase of puts to hedge my positions.
If investors do not have this
confidence they will continue to second guess themselves and
hesitate when they select the moment to buy and sell their
puts. Option premiums in a down trending market change
quickly. Hesitation can make the different between a good
entry and exit point and a poor one. Some investors that are unsure that the market is changing its
trend, buy a handful
of puts on the stocks they already own. That way they feel
they are
still hedged to a certain degree.
Here is how I trade the
SPY puts in a downturn. I try to always stay just
slightly in the money (ITM) when I buy the puts and I always
try to follow the market and buy them on a bounce or near
what looks like a high for the day. I like slightly ITM as
it holds its premium a little better on an upswing (should
the market not go down) and gives me a chance to get out
with a smaller loss. I never buy the closest month. I always
buy the next month out. This is because premium decreases
quicker in the closest month. If my market timing was wrong
and the market turns up NOT down, the closer month will lose
premium more than the next month out. It goes without saying
then, that if the market is indeed falling, the closer
month's puts will not have as much premium as the next month
out.
As to the number of
put contracts bought, I believe it all depends
on an investor's comfort level and the amount of stock they are
holding. If I was holding 2000 shares then perhaps 10 puts
is comfortable. Every investor has a different level.
Primarily I am seeking some capital income from a market
downturn. Therefore I set aside an amount of capital and
that determines how many puts I can afford to buy. In 2010
for example I set aside 12,000 for Spy put purchases.
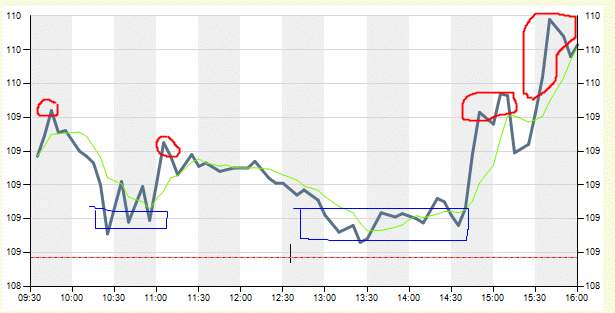
I pick the opening price for the
day, look for a bounce and then buy my Puts. A good example
is Jan 27 2010 below. The red shows high points during the
day and the blue shows areas where you could consider
selling during the day. So how do I tell when to buy the
puts?
A) For me I have
confidence that the market is moving lower, so that means if
by chance I buy my puts at the wrong moment I have
confidence that the market will move lower than where I
bought them, perhaps not today, but maybe tomorrow.
B) I plot out the 5 period simple moving average for the day. It's
the green line on the charts below. Any time the SPY is
above the 5 period SMA are good points for me. The higher above,
the better. I know I can never catch the top nor the bottom,
but through practice I can catch when the spy turns lower
after rising.
C) I use a stop loss above where I bought my puts and move
it lower if the SPY trends lower, but I am willing to take a
loss, again because I believe that should I get stopped out
on a move higher, I can buy back in at a higher price and
recover my loss on the next move down.
D) When the market moves lower I put in my sell point.
On
Jan 27 2010 for example (above), any of the red points were good
buys. Any of the blue points were good areas to sell. In the
morning I put my sell in at $4.15 which was just before
10:30 AM. The market then drifted higher. At around 1:10 PM
or so, I was filled at $4.15 and the market drifted even
lower, but I did not buy back in as most of the time it was
below the 5 period average. I waited and I almost bought in at
around 3:00 PM which would have been fine, but then the
market fell below the 5 period moving average before I was filled and
then shot up again. That's when I bought back in, on the
second bounce in the later afternoon just before the close.
A lot of investors would not have bought in at the close as
they don't want to hold the puts over the evening to the
next day. I don't mind so much during the week. Weekends are
different. A lot can happen over a weekend. During the week
I will buy back in because I have the confidence that the
trend is still lower. Remember, it is easy to be wrong and
the close of the day on Jan 27, (below) could have
been a big mistake. The market could have jumped higher the
next day at the open. This is again where confidence has to
come in. In my instance my indicators showed that the trend
was
down. As I have faith in the 5 period moving average strategy I buy the puts,
knowing full well I can easily be wrong and the market could
in fact have bottomed on that day at the close and will move
higher. It's impossible to be right all the time, but if I
continually wait for the "perfect" time, that time will
never arrive.
E) Since I know from experience that I can never be
right all the time, I only hold for a short period and
sell often in the same day, to capture my profit. My
strategy is to build up a cash cushion to assist me when the
market turns and my put buying will be the incorrect
strategy. A cash cushion will insure that I have a profit
from the market downturn.
I never hold my puts for long. I am never interested in
holding puts throughout a downturn and then try to pick
the bottom. I prefer to keep buying and selling
throughout a downturn in order to build my cash cushion
larger and larger to ensure there is a profit when the
bottom is reached and the market bounces.
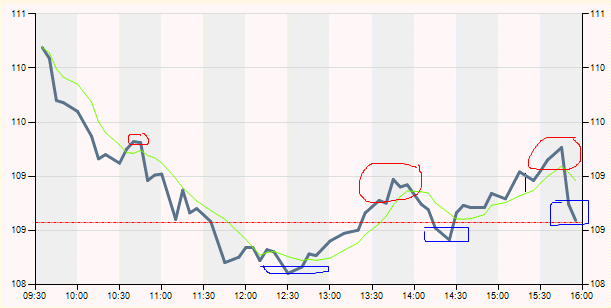
Above
is Jan 28 2010. Not as many points to try to buy in
until the afternoon. However if I had bought in the
morning at just after 10:30 on that little bounce, I could
have set my sell price around 11:40 AM or 12:30 PM but I
would not have been filled on Jan 29. I could also set
my stop loss at the day's high at the open. The next day
(Jan 29) I definitely would have been filled.
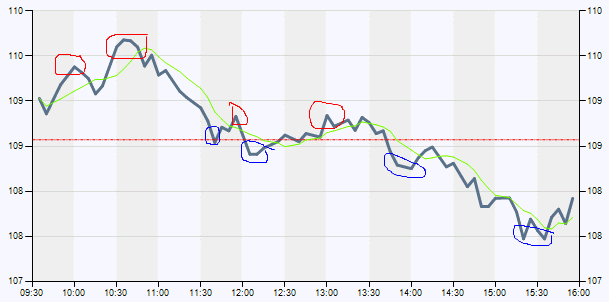
Jan
29 2010 above is the last chart. Again the red are areas
I would
consider buying and blue consider selling or picking a
selling price to enter. On Jan 28 2010, I was holding puts
from Jan 27. I sold them around 12:30 and then bought back
in around 3:40 PM when the market hit around 109.75. I
immediately put in my sell price for $4.30 and was
pleasantly surprised
to get filled right near the close.
It was easy to buy the second move higher
around 10:30 as the market started to pull back. But at
first I thought the market might go sideways and I thought it was
better to hold to my position over the weekend. However by
3:30 PM with the market below 108 (support level), I took
the profit and determined I would rather reassess Monday
morning before picking my point to buy the puts again.
Why do all these
trades? Why not just buy the puts on Jan 22 and hold until
the market gives a clearer direction lower or higher? I am not into day
trading, so why am I trading the spy like this? When I trade
the SPY in a down market I want to build a cash cushion. For
example with my trades below, by Thursday I have built up a
30% return or $4153.00 in cash. This will go a long way
to cover losses should the very next day I buy into the market and instead
of going down it moved higher. Rather than be sitting with a
loss I am basically giving back some of the profit I have
made earlier.
Once I have a cushion, I can decide whether I want to
hold the puts longer, perhaps two or more days, or whether I
would like to continue to trade them daily. One thing you'll
notice is that the daily trading from Jan 22 to Jan 29 were
almost all within the same strike ranges, from $110.00 to
about $108.00. I am not surprised by this as $108 was
support and normally the SPY should bounce off support a few
times and either move higher or begin the move lower, which
we saw on Friday Jan 29. Once the move lower has begun I
would expect the market to continue to move even lower to
the next support at 1050 and if it fails to hold then 1030
or 1035. The move on Friday Jan 29 was dramatic and tells me
that the market could very well be in larger trouble than
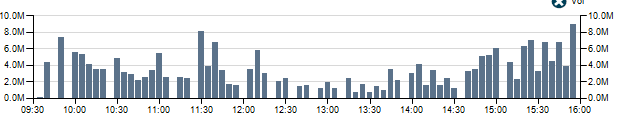
many realize. The chart below shows the volume for Jan 29
2010.
The market had a strong move
higher in the morning and fairly good volume, but then the
second move higher was on dwindling volume and as the market moved
lower through the day the volume became thin. By 2:40 PM as
the market moved lower, volume increased telling me that the VIX is probably higher as investors are becoming unsettled.
Everyone likes to think that the panic seen in September and
October 2008 as well as February and March 2009, is a rare
event. Most investors think, "this time if the market starts
to move lower I will be ready to add to any positions I have
not sold out" or buy new positions, but when a drop comes,
most investors including professionals and the "smart money" panic and very few
want to put more capital at risk. The panic feeds on itself
and more selling arrives. Buyers start dropping off and the
price of shares falls dramatically lower, which adds more
fuel to the panic. When that happens, it's easy to tell
because the volume chart picks up AND the indexes fall
dramatically.
During such a dramatic downturn I usually
hold on for the day until I feel the profit is
warranted OR the volume starts to die off. I do not believe anyone can go wrong by taking
profits whenever they wish. If the market is going to move
lower, there will continue to be times when you can buy puts
again. When there is a dramatic downturn there will be large
jumps higher which will present new opportunities to buy
the puts again.
Eventually I
will be wrong with my puts and the market will move higher
leaving me with a loss. I can never tell when the market is
going to make that bottom and move higher rather than
continue lower. I don't truly think anyone can, which is why
I like to build my cash cushion early in the downturn.
I like to
build my cash cushion larger and larger throughout the
year, because I know there will be times when I buy puts, I am
going to be wrong.